Feed aggregator

How Buyers Can Compare Real Estate Professionals Without Feeling Overwhelmed

Money Under 30 -

Choosing a real estate professional can quickly feel messy. Buyers often sort through profiles, reviews, local track records, communication habits, and recommendations from people they trust. The search becomes easier when they narrow the lens.  Buyers looking in a specific area may gain more from realtors familiar with the Yuma, AZ housing market. Local experience […]

Q2 GDP Expectations Cool—But Some Economists Aren’t Worried

The Capital Spectator -

US economic growth estimates for the second quarter have weakened, according to recent nowcasts. The downturn suggests that output will slow in the upcoming Q2 GDP report, based on the median for a set of nowcasts compiled by The Capital Spectator.

Growth for Q2 is currently estimated at a sluggish 1.5% (real annualized rate). The new median nowcast marks a material slowdown from the 2.1% increase reported for Q1.

Today’s revised Q2 estimate marks a significant downshift from the 2.5% estimate in our previous update (June 22).

The softer nowcast reflects three factors in recent data: lower exports, a decline in expectations for consumer spending, and cooler forecasts for domestic investment. The combination of these changes has weighed on some nowcasts, including the Atlanta Fed’s GDPNow model, which is currently nowcasting Q2 growth at just 1.2% (July 1) — down sharply from 3%-plus a few weeks earlier.

But some economists say the downshift is less worrisome than it appears and is mostly an accounting-based adjustment rather than a genuine decline in economic activity. Renaissance Macro Research, citing the softer GDPNow estimate, last week noted:

We wouldn’t get too carried away with this. While Q2 GDPNow is lower, the bulk of the recent drop stems from a wider trade gap. Excluding net exports and inventory investment, private domestic demand is tracking close to 2.5 percent, which is respectable.

The strongest nowcast in the chart above is the New York Fed’s 2.74% estimate (July 3) — essentially unchanged in recent weeks and well above GDPNow’s 1.2%, the weakest of the group.

The government’s official Q2 report is scheduled for July 30, leaving the possibility that incoming data could revive the weaker estimates. As for The Capital Spectator’s view, our standard practice is to use the median as the best real‑time guesstimate.

If the optimists are right and Q2 activity is stronger than some nowcasts suggest, the median will move higher in the weeks ahead of the official data.


Will Markets Start To Price In Lower Inflation Risk?

The Capital Spectator -

The Iran war appears to be over, or so the ongoing ceasefire suggests. The oil market is certainly leaning into that view: the price of crude has dropped sharply in recent weeks and begins trading this week at around $70 a barrel for the U.S. benchmark, marking a return to the level on the eve of the war’s start on Feb. 28.

The unwinding of the war premium in oil points to softer inflation expectations, particularly at the headline level, which uses energy costs as inputs. The current inflation nowcasts from the Cleveland Fed anticipate that the year-over-year change in the Consumer Price Index peaked at 4.2% in May and will drop to 3.9% in the upcoming June report and 3.5% in July. Core CPI, which is running at a softer pace, is also expected to ease.

A new round of disinflation will give the Federal Reserve more time to consider the case for a hawkish pivot. Doves argue that rate hikes should be off the table in the wake of oil’s latest slide.

The Fed’s current policy stance has recently shifted to neutral from a modest hawkish tilt, according to The Capital Spectator’s estimate, based on a simple model that uses unemployment and headline CPI—proxies for the central bank’s dual mandate.

Assuming that the recent inflation surge is reversing suggests that the Fed can continue to be patient in deciding how, or if, to adjust monetary policy. A key question for the week ahead: Will the Treasury market validate the view that inflation risk is fading and that rate hikes are no longer needed?

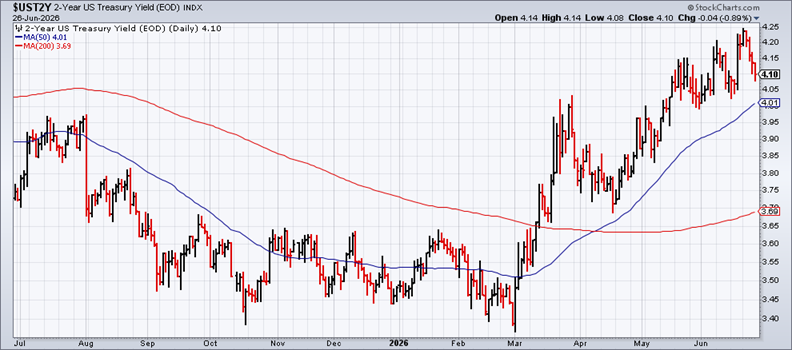
The 2-year Treasury yield is the frontline for monitoring investor sentiment on the policy outlook. As the week begins, this corner of the bond market is pricing in high odds for one or more rate hikes. The 2-year yield ended last week’s trading at 4.18%—close to a one-year high and substantially above the Fed’s 3.50%–3.75% target range.

The Fed funds futures market is pricing in moderately high odds (76%) for no change at the next FOMC meeting on July 29. The outlook turns modestly hawkish for the September rate decision.

Will this week’s market activity lean into the dovish view? Several factors will inform the outcome, starting with the news flow from the Middle East, and so no news will continue to be good news on this front.

The other key variable is the incoming numbers for the U.S. economy, which has been relatively resilient during the war. Will the return of peace (and lower energy costs) further strengthen the economic trend? If so, will that undercut the view that the Fed can leave policy unchanged?

A useful real-time monitor of economic activity is the Dallas Fed’s Weekly Economic Index (WEI), which is currently nowcasting year-over-year GDP growth at around 2.6%. That’s roughly in line with the year-over-year rise previously reported for Q1 growth.

The main takeaway: the case for leaving Fed policy unchanged still looks like a reasonable estimate for the near term, which implies a moderately lower 2-year Treasury yield. The key assumptions supporting this outlook: the ceasefire in the Gulf holds (and broadens into a more durable peace deal), oil exports continue to rebound and normalize, and U.S. economic activity doesn’t accelerate on the back of lower energy costs.

Is Recession Risk Rising? Monitor the outlook with a subscription to:
The US Business Cycle Risk Report

Total Return Forecasts: Major Asset Classes | 2 July 2026

The Capital Spectator -

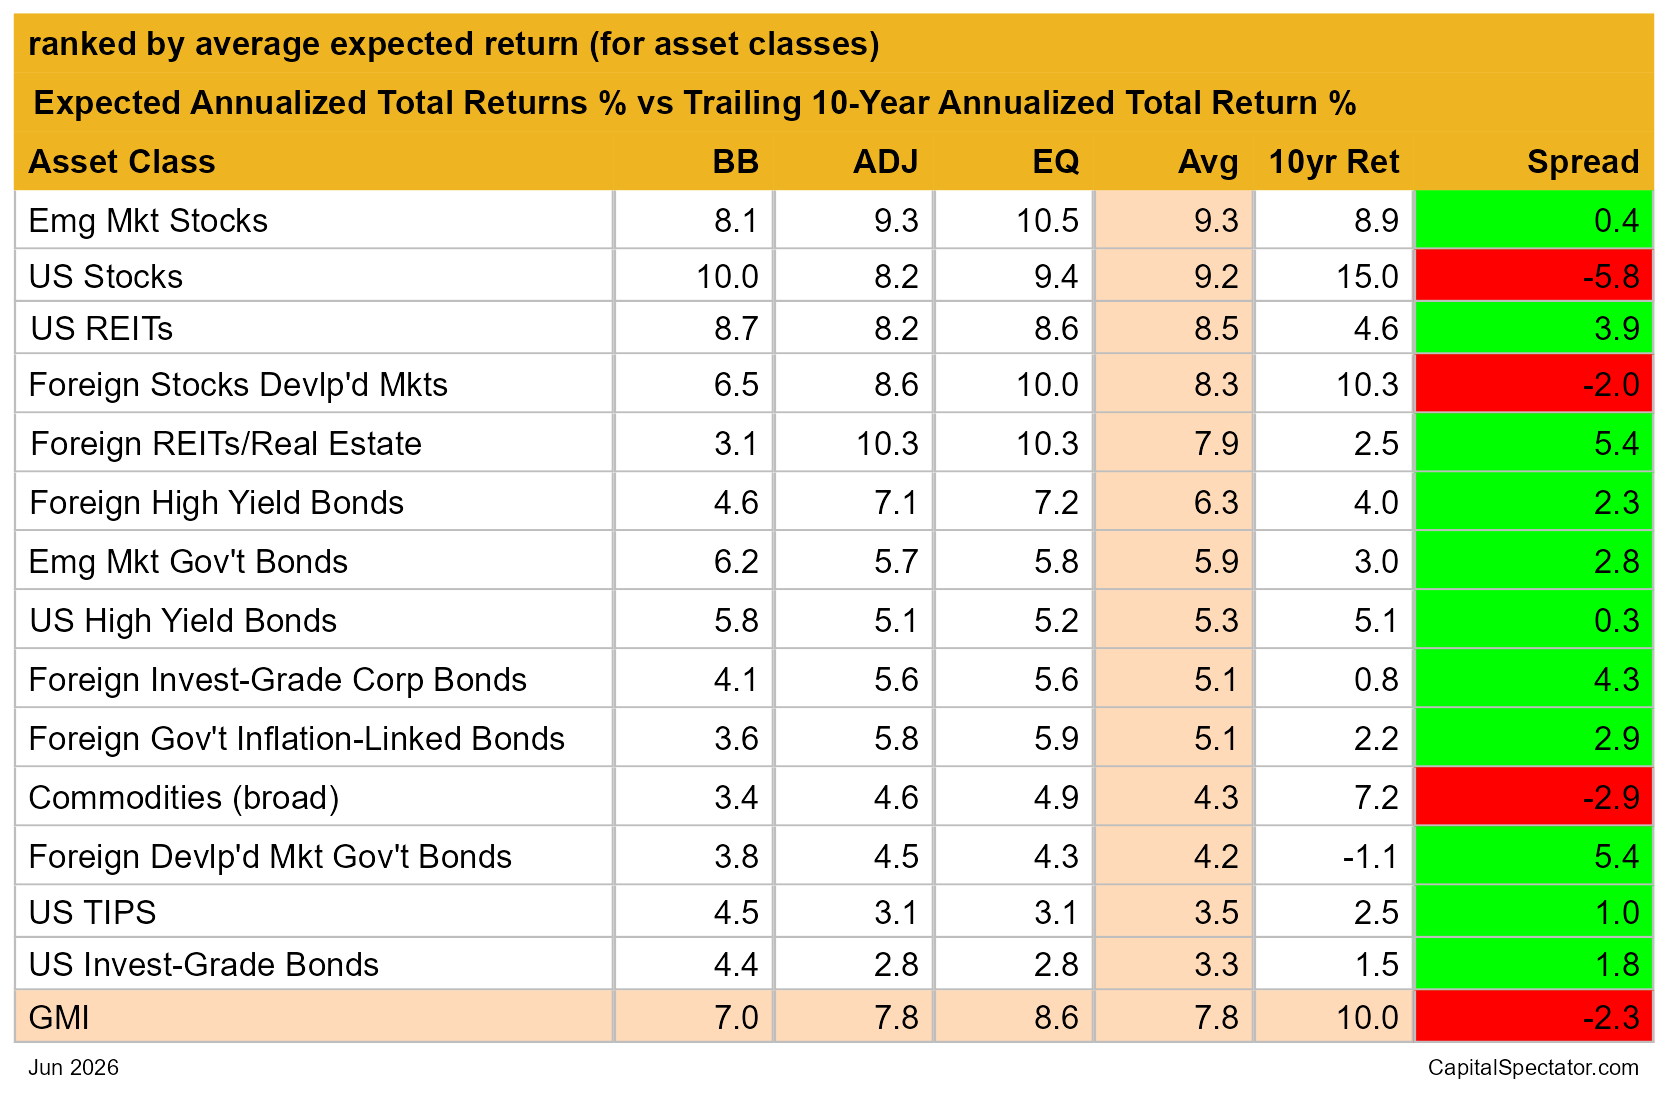
The outlook for long-term total return for the Global Market Index (GMI) edged up again in June, touching the highest level in recent history. Despite the recent rise, the expected performance remains well below GMI’s realized return over the trailing ten-year window. In other words, GMI performance is forecast to downshift relative to the past decade.

GMI is a market-value-weighted mix of the major asset classes (excluding cash) via ETF proxies. Today’s update reflects the average of three models (defined below).

The current 7.8% annualized estimate for GMI is slightly above last month’s forecast, and substantially below the benchmark’s trailing 10.0% annualized return for the past decade.

Note that several of GMI’s components are projected to generate returns below their respective results for the past ten years (indicated by the red boxes in the far-right column below). The most extreme spread is in US stocks, which are projected to a substantially softer, although still robust, return compared with history. GMI’s outlook is also below vs. its trailing ten-year history through May: 7.8% vs. 10.0%.

GMI represents a theoretical benchmark for the “optimal” portfolio that’s suited for the average investor with an infinite time horizon. Accordingly, GMI is useful as a starting point for customizing asset allocation and portfolio design to match a particular investor’s expectations, objectives, risk tolerance, etc. GMI’s history suggests that this passive benchmark’s performance will be competitive with most active asset-allocation strategies, especially after adjusting for risk, trading costs and taxes.

It’s likely that some, most or possibly all of the forecasts above will be wide of the mark in some degree. GMI’s projections, however, are expected to be somewhat more reliable vs. the estimates for its  components. Predictions for the specific markets (US stocks, commodities, etc.) are subject to greater variability compared with aggregating the forecasts into the GMI estimate, a process that may reduce some of the errors through time.

Another way to view the projections above is to use the estimates as a baseline for refining expectations. For instance, the point forecasts above can be adjusted with additional modeling that accounts for other factors and assumptions not used here. Customizing portfolios for a specfic investor, to reflect risk tolerance, time horizon, and so on, is also recommended.

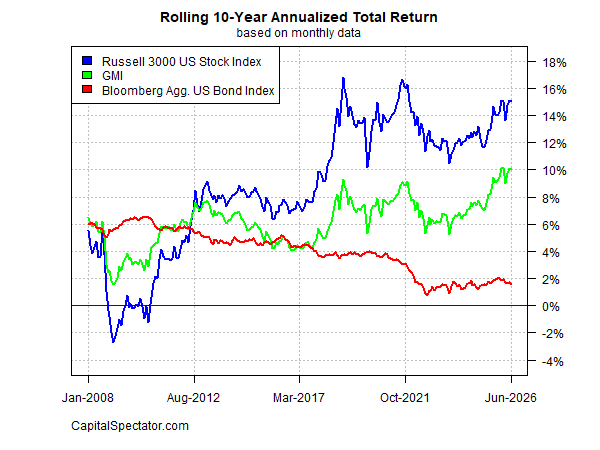
For perspective on how GMI’s realized total return has evolved through time, consider the benchmark’s track record on a rolling 10-year annualized basis. The chart below compares GMI’s performance vs. ETFs tracking US stocks and US bonds through last month. GMI’s current return for the past ten years is a robust annualized 10.0%.

Here’s a brief summary of how the forecasts are generated and definitions of the other metrics in the table above:

BB: The Building Block model uses historical returns as a proxy for estimating the future. The sample period used starts in January 1998 (the earliest available date for all the asset classes listed above). The procedure is to calculate the risk premium for each asset class, compute the annualized return and then add an expected risk-free rate to generate a total return forecast. For the expected risk-free rate, we’re using the latest yield on the 10-year Treasury Inflation Protected Security (TIPS). This yield is considered a market estimate of a risk-free, real (inflation-adjusted) return for a “safe” asset — this “risk-free” rate is also used for all the models outlined below. Note that the BB model used here is (loosely) based on a methodology originally outlined by Ibbotson Associates (a division of Morningstar).

EQ: The Equilibrium model reverse engineers expected return by way of risk. Rather than trying to predict return directly, this model relies on the somewhat more reliable framework of using risk metrics to estimate future performance. The process is relatively robust in the sense that forecasting risk is slightly easier than projecting return. The three inputs:

* An estimate of the overall portfolio’s expected market price of risk, defined as the Sharpe ratio, which is the ratio of risk premia to volatility (standard deviation). Note: the “portfolio” here and throughout is defined as GMI

* The expected volatility (standard deviation) of each asset (GMI’s market components)

* The expected correlation for each asset relative to the portfolio (GMI)

This model for estimating equilibrium returns was initially outlined in a 1974 paper by Professor Bill Sharpe. For a summary, see Gary Brinson’s explanation in Chapter 3 of The Portable MBA in Investment. I also review the model in my book Dynamic Asset Allocation. Note that this methodology initially estimates a risk premium and then adds an expected risk-free rate to arrive at total return forecasts. The expected risk-free rate is outlined in BB above.

ADJ: This methodology is identical to the Equilibrium model (EQ) outlined above with one exception: the forecasts are adjusted based on short-term momentum and longer-term mean reversion factors. Momentum is defined as the current price relative to the trailing 12-month moving average. The mean reversion factor is estimated as the current price relative to the trailing 60-month (5-year) moving average. The equilibrium forecasts are adjusted based on current prices relative to the 12-month and 60-month moving averages. If current prices are above (below) the moving averages, the unadjusted risk premia estimates are decreased (increased). The formula for adjustment is simply taking the inverse of the average of the current price to the two moving averages. For example: if an asset class’s current price is 10% above its 12-month moving average and 20% over its 60-month moving average, the unadjusted forecast is reduced by 15% (the average of 10% and 20%). The logic here is that when prices are relatively high vs. recent history, the equilibrium forecasts are reduced. On the flip side, when prices are relatively low vs. recent history, the equilibrium forecasts are increased.

Avg: This column is a simple average of the three forecasts for each row (asset class)

10yr Ret: For perspective on actual returns, this column shows the trailing 10-year annualized total return for the asset classes through the current target month.

Spread: Average-model forecast less trailing 10-year return.


Major Asset Classes | June 2026 | Performance Review

The Capital Spectator -

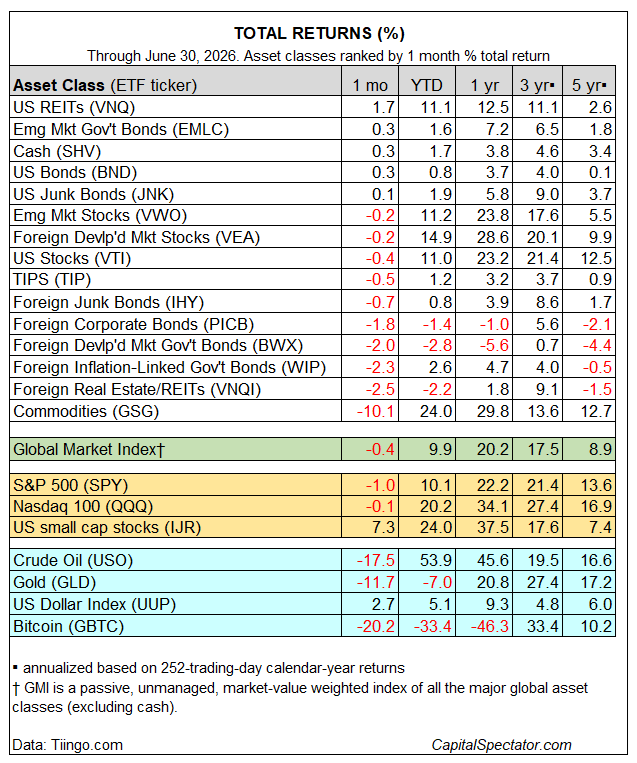
Markets were mixed in June after two solid monthly gains, based on a set of ETFs. Most of the major asset classes lost ground last month, with a handful of exceptions on the upside, led by US real estate investment trusts.

Vanguard Real Estate ETF (VNQ) was the performance leader for the major asset classes in June, posting a 1.7% gain. That was enough to put it well ahead of the pack last month.

The majority of the major asset classes fell, which translates into the softest month since the widespread selling in March following the start of the military strikes on Iran.

The biggest loser in June: broadly defined commodities (GSG), which tumbled 10.1%. Note, however, that commodities continue to hold the commanding heights for year-to-performance via a 24.0% gain.

US stocks (VTI) eased in June, dipping 0.4%, consolidating after leading markets higher for two straight months. Within the US equities space, small-cap stocks (IJR) bucked the trend with a solid gain, jumping 7.3%.

US bonds (BND), by contrast, edged higher, extending a mild rebound after a sharp loss in March.

Year to date, most markets are up. The exceptions: foreign bonds (BWX and PICB) and global property shares ex-US (VNQI). Bitcoin (GBTC) was exceptionally weak, shedding more than 20% in June, and tumbling by roughly a third so far this year.

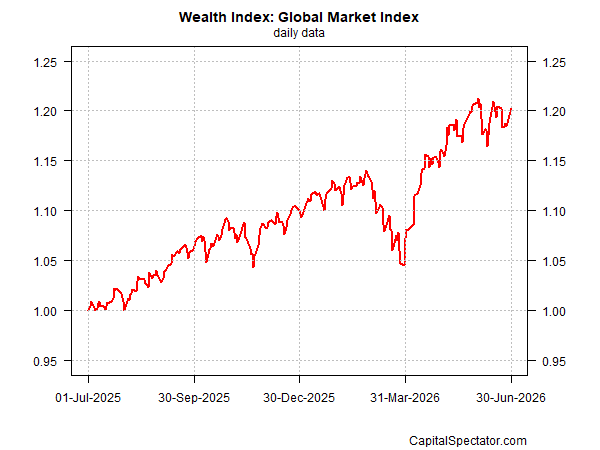
The back-to-back monthly gains for Global Market Index (GMI) ended in June with a fractional 0.4% loss, weighed down by weak equity markets generally last month. Year to date, however, GMI is holding on to a solid 9.9% gain.

GMI is an unmanaged benchmark (maintained by The Capital Spectator) that holds all the major asset classes (except cash) in market-value weights via ETFs and serves as a competitive benchmark for globally diversified, multi-asset-class portfolio strategies.

Will Micro Caps Steal The Momentum Factor’s Performance Crown?

The Capital Spectator -

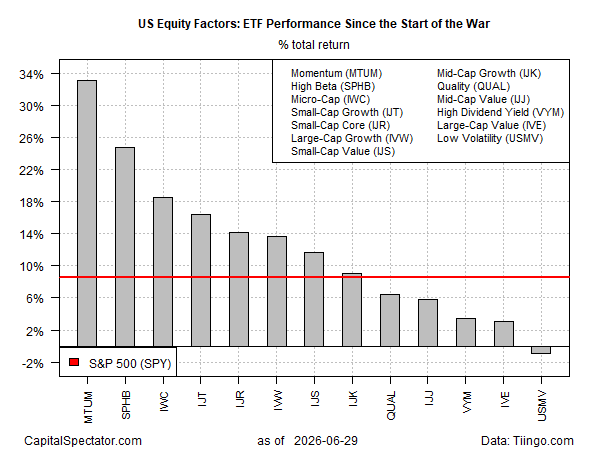
Momentum continues to stand out as the dominant equity risk factor since the war with Iran began on Feb. 28. Using a set of ETFs as proxies highlights that this slice of the stock market remains, by far, the strongest performer since the Middle East crisis shocked the global economy.

The iShares MSCI USA Momentum Factor ETF (MTUM) has soared more than 32% since the initial attacks on Iran—an extraordinary gain compared with the rest of the field. The second-best performer, high-beta stocks (SPHB), is up 23%, while the market benchmark, the SPDR S&P 500 ETF (SPY), has increased by 8.1%.

All but one of the factor ETFs are posting gains. The downside outlier is low-volatility (USMV), which is fractionally lower since the war began.

Low vol’s relatively weak run predates the war, raising questions about the factor’s standard selling points: higher risk-adjusted returns and superior capital preservation. Those attributes are arguably still in play, but after trailing the broad market by a wide margin in recent years, the argument that all is well after adjusting for risk has come under increasing strain.

In fact, risk management generally has been on the defensive lately. Taking on more risk can pay off, of course, but the embrace of higher-volatility assets and strategies has enjoyed an unusually strong run lately.

Speaking of underperforming factors, micro- and small-cap stocks are rallying again, inspiring forecasts that the tide is finally turning for these shares. We have heard that call many times in recent years, only to learn that the optimism was premature.

Could this time be different? A change of the trailing timeframe suggests it already is.

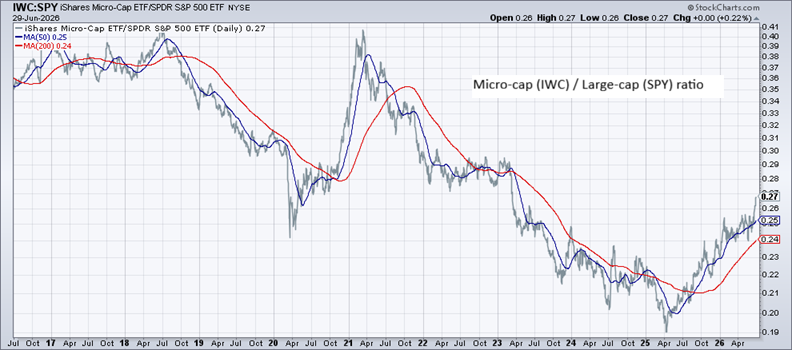
Notably, micro-cap stocks (IWC) are handily outperforming momentum (MTUM) as well as the broad market (SPY) over the past 12 months. The relative strength of micro-caps dates back a bit more than a year. After suffering weak performance for years, the tide began to turn in the spring of 2025 and hasn’t looked back since.

Analysts cite several reasons for the rotation into micro-caps, including the view of some that these stocks are surrogates for private equity, another hot asset class of late. Another line of reasoning points to the relatively resilient earnings reports for smaller firms recently. Low valuations compared with soaring tech and AI shares are another plus.

Whatever the rationale, the trend analysis agrees. As the chart above highlights, a clear shift is underway. After years of false starts, micro-caps—and perhaps small-caps overall—appear poised to deliver competitive results after a lengthy dry spell.


US Stocks Still Lead Global Markets Since Iran Conflict Erupted

The Capital Spectator -

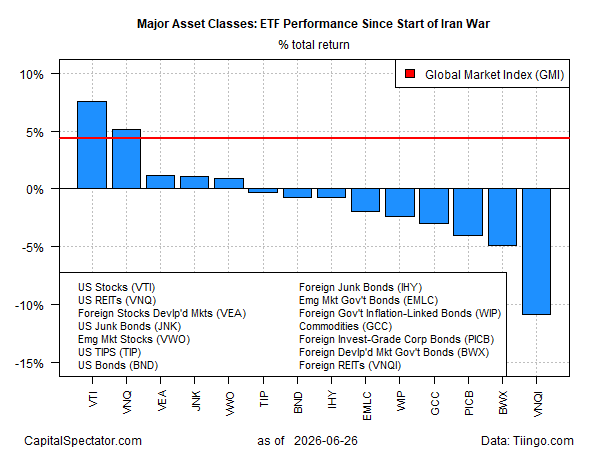
Geopolitical analysts are debating who triumphed in the Middle East conflict, but judging by asset prices the US is the clear winner. Measuring the major asset classes through a set of ETF proxies shows that American equities are the victors in the battle for performance through Friday’s close (June 26).

The Vanguard Total US Stock Market ETF (VTI) has rallied 7.8% since the US and Israel attacked Iran on Feb. 28. US real estate investment trusts (VNQ) are in second place, rising a bit more than 5% since the war began.

The rest of the field is far behind, posting either modest gains or losses. For some markets, the setback since the fighting started has been steep. Global property stocks ex-US (VNQI) have been hit especially hard, losing nearly 11%.

The outperformance of American shares is striking but not surprising for two reasons. First, the US has become the world’s largest oil producer and therefore enjoys near self‑sufficiency in energy. Oil is still priced globally, so the loss of crude exports from the Gulf has driven up energy prices in America. But the ability to produce oil and gas at levels that minimize reliance on imports has been a crucial factor in the US economy’s resilience.

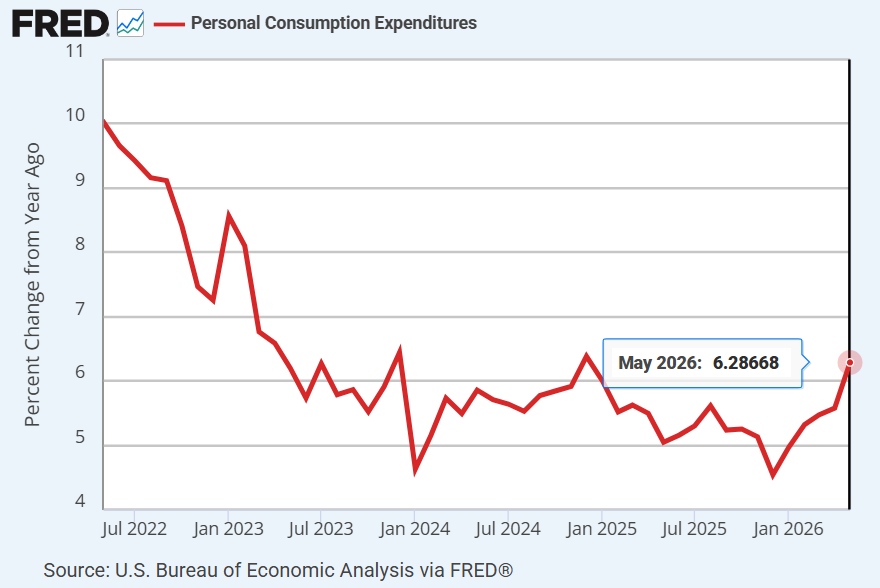
Last week the government reported that US consumer spending—a key driver of economic activity—accelerated in May, suggesting that the effects of the Middle East conflict have had limited impact to date on Main Street business activity.

US consumer spending accelerated in May even as prices rose at the fastest pace in more than three years, suggesting Americans are looking through the fallout from the Iran war. The strength is lifting the year‑on‑year trend for personal consumption expenditures, which rose 6.3% through last month, the strongest pace in a year and a half.

Strong earnings growth is also supporting the US market. FactSet reports that S&P 500 earnings grew a robust 23% in Q2 versus the year‑ago level, marking the second straight quarter of earnings growth above 20%.

Inflation remains the wild card for both the economy and financial markets. Analysts continue to debate whether the run‑up in headline inflation from higher oil prices will be temporary. The sharp pullback in oil prices in recent weeks appears to be persuading the bond market that if the Federal Reserve raises interest rates, the policy shift will be modest and perhaps short‑lived.

The optimistic scenario for inflation will come under more strain if the policy‑sensitive US 2‑year Treasury yield rises further. Since March, this maturity—widely followed as a proxy for Fed rate expectations—has climbed sharply. But on Friday it fell for a fourth day, settling at 4.1%.

If the 2‑year yield resumes its upward trajectory and moves further above the Fed’s current 3.50%–3.75% target range, headwinds for stocks will likely strengthen. Higher Treasury yields would signal heightened concern about the inflation outlook and the need for Fed rate hikes. At the same time, bonds would present a more competitive alternative to equities.

News flow from the Iran conflict will continue to play a key role in how markets assess geopolitical and macro risks. As of this morning, yet another deal has been announced between the US and Iran to “stand down” following a series of attacks in and around the Strait of Hormuz.

The question is whether the market impact of the Middle East conflict is fading as investors become acclimated to the new status quo in the Gulf. The answer will be driven at least partly by the directional bias of the 2‑year yield in the days and weeks ahead.

Is Recession Risk Rising? Monitor the outlook with a subscription to:
The US Business Cycle Risk Report

Book Bits: 27 June 2026

The Capital Spectator -

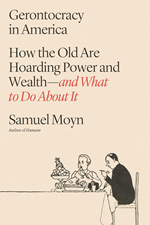
Gerontocracy in America: How the Old Are Hoarding Power and Wealth―and What to Do About It
Samuel Moyn
Review via The Economist
America is ruled by the old, argues Samuel Moyn, a Yale professor, in “Gerontocracy in America”. It is not just that Donald Trump is 80 or that his predecessor left office at 82 and was palpably impaired. Mr Moyn sees a society that privileges the elderly, blocks the young and “is more set on preservation than on renovation”.
When it comes to politics, he has a point. American lawmakers grow mightier with seniority, and there is no good mechanism for getting rid of them when they can no longer do their jobs. Kay Granger, a member of Congress from Texas, served despite living in a retirement home and suffering from dementia. Dianne Feinstein, a senator from California who died in office at 90, often failed to understand what was going on around her.

Cheating: The Human Project and its Betrayal
Fred Harrison
Summary via publisher (Shepheard-Walwyn)
Five thousand years ago, humanity made a huge mistake. The income generated from shared land, known as economic rent, was taken by chiefs and priests instead of being used for everyone’s benefit. Every unfair tax, every preventable death from poverty, and every financial crash since can be traced back to this original betrayal. Drawing on evolutionary science and years of accurate economic predictions, including the 2008 financial crisis, Fred Harrison reveals the “culture of cheating” built into the foundations of modern society. He explains how mainstream economics deliberately removed the idea of rent and how governments choose to tax wages instead of land, harming prosperity and shortening lives. With five major crises: political gridlock, environmental collapse, mass migration, authoritarianism, and uncontrolled artificial intelligence, set to clash around 2028, Harrison makes an evidence-based case for tax reform: replacing taxes on labour with Annual Ground Rents and sharing rents between nations to resolve conflicts from Gaza to the global climate crisis.

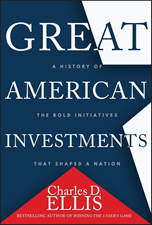
Great American Investments: A History of the Bold Initiatives that Shaped a Nation
Charles D. Ellis
Summary via publisher (Wiley)
In Great American Investments, legendary investor Charles D. Ellis reveals the fascinating stories behind the decisions that shaped America. From the Louisiana Purchase that doubled the nation’s size to Land Grant Colleges that democratized education, Ellis explores how bold investments in people, land, and infrastructure transformed a young country into a land of unprecedented opportunity.

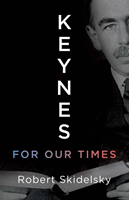
Keynes for Our Times
Robert Skidelsky
Adaptation via IMF.org
Artificial intelligence has a penchant for pronouncements that are clear, confident…and often wrong. More than a passing technical flaw, this speaks to the difficulty we all—including AI’s human architects—face in dealing with uncertainty. John Maynard Keynes, in contrast, understood that the future is essentially unknowable, and it is “better to be vaguely right than precisely wrong.” This insight remade economics in the 20th century, and it is but one of his ideas that are even more relevant in our own extremely uncertain times.

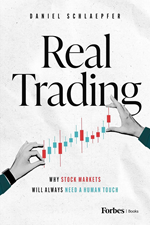
Real Trading: Why Stock Markets Will Always Need a Human Touch
Daniel Schlaepfer
Press release via PR Newsire
Real Trading explores the evolution of global markets, the rise of high-frequency trading, the retail trading boom, the risks of dark pools and payment for order flow, and the growing confusion between trading, gambling and entertainment. Schlaepfer also takes aim at the rise of so-called “funded trader” programs, arguing that many of them are designed less to develop professional talent than to profit from repeated failure.
“Too many funded trader businesses are not really funding traders,” Schlaepfer said. “They are funding a funnel. Their economics depend on people failing challenges, paying again and believing the next attempt will be different. That is not professional development. It is extraction dressed up as opportunity.”

Please note that the links to books above are affiliate links with Amazon.com and James Picerno (a.k.a. The Capital Spectator) earns money if you buy one of the titles listed. Also note that you will not pay extra for a book even though it generates revenue for The Capital Spectator. By purchasing books through this site, you provide support for The Capital Spectator’s free content. Thank you!

How to Reduce Screen Time in an Office Job

Money Under 30 -

If you work in an office, screen time is inevitable. In fact, you might regularly spend eight or nine hours per day on a screen – dealing with messages, meetings, calendars, and software. But is this sustainable? One recent survey found that the average office worker spends around 1,700 hours a year in front of […]

Core Inflation’s Persistence Raises Questions for the Fed’s Strategy

The Capital Spectator -

The Federal Reserve has been keeping interest rates steady, waiting to see whether the recent inflation surge will be temporary. That decision carries more risk after yesterday’s update of the Personal Consumption Expenditures (PCE) index for May, which shows that pricing pressure is increasing for reasons beyond surging energy costs tied to the Iran conflict.

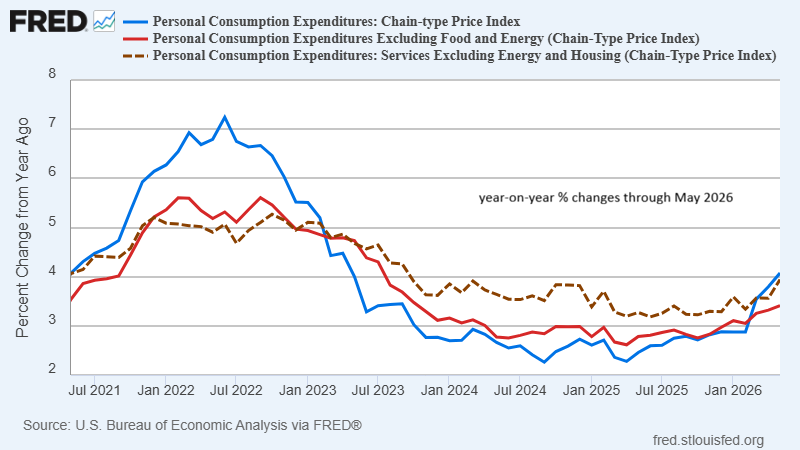
Headline PCE rose to a 4.1% year‑over‑year increase last month, the fastest pace in three years (blue line in the chart below). The view that energy costs have peaked—and will continue to fall—suggests that headline inflation will soon turn lower. But yesterday’s release highlights that inflation pressures are still building for reasons unrelated to energy, giving the Fed less room to argue that it can remain patient in deciding whether a hawkish pivot in monetary policy is necessary.

Core PCE inflation, which excludes food and energy, rose again to a 3.4% annual pace last month (red line in chart above). Another worrisome sign is the hotter trend in PCE services prices excluding energy and housing, which also extended its recent acceleration, rising 3.9%.

The implication: the Fed mahy be starting to lose control of the pricing trend, and for reasons that can’t be blamed on energy costs or the Iran war. A substantial reversal in inflation pressures in upcoming reports—particularly in the core readings—could buy the Fed more time to test the “inflation is transitory” narrative. But that is becoming a dangerous game.

At some point, if inflation pressure unrelated to energy continues to pick up, the central bank could face a repeat of 2021–2022, when it waited too long to respond to soaring prices. Although the current environment is less intense than the pandemic‑driven inflation surge several years ago, the threat to the Fed’s credibility is arguably higher in 2026 as Kevin Warsh, the new Fed chair, works to establish his policy bona fides.

If financial markets lose confidence early in Warsh’s tenure, his job of delivering “price stability,” as he vowed last week, will become more difficult.

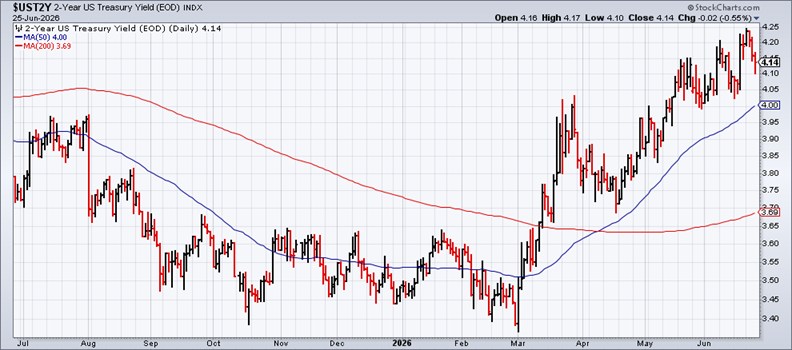
The bond market may ultimately determine whether the Fed is losing control of inflation. For now, investors are still willing to give Warsh the benefit of the doubt. The policy‑sensitive 2‑year yield edged lower yesterday for the third straight session. Yet the current 4.14% level keeps the recent uptrend intact and remains well above the Fed’s 3.50%–3.75% target range, reflecting the market’s expectation of further rate hikes.

Fed funds futures continue to lean toward no change at next month’s policy meeting, but the odds shift in favor of tightening in September.

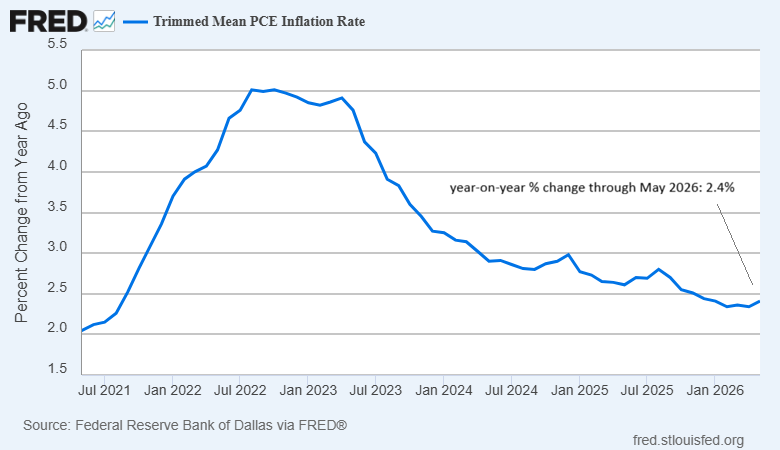
The counterargument is that the “trimmed mean” measure of inflation—which removes the most extreme price moves each month and which Warsh has cited as a preferred gauge—continues to show relatively subdued pricing pressure. This version of PCE inflation, calculated by the Dallas Fed, ticked up last month, but its 2.4% annual pace looks far less concerning than the trends noted above.

Although some economists argue that trimmed‑mean inflation indexes are superior to traditional core metrics, recent history is not encouraging. Notably, PCE trimmed‑mean inflation was slow to respond to the inflation surge in 2021–2022.

That raises the question: Will Warsh bet heavily on the trimmed‑mean’s softer inflation message?

Ultimately, the trajectory of inflation in the coming months will determine whether the Fed can preserve its institutional credibility. Should underlying price pressures continue to firm, the central bank may find itself compelled to tighten policy more aggressively than currently anticipated—an outcome that would underscore the costs of delayed action.

Learn To Use R For Portfolio Analysis
Quantitative Investment Portfolio Analytics In R:
An Introduction To R For Modeling Portfolio Risk and Return

By James Picerno

The Frugalista’s Guide to Funding Life’s Biggest Investments

Money Under 30 -

Big financial goals rarely arrive all at once. They build over time, quietly waiting in the background until the moment you decide to act. A home, an education, a business, a family, these are the milestones that shape a life, and they tend to carry the heaviest price tags. The frugal mindset doesn’t shy away […]

Oil Falls to Post‑War Low but Fed’s Path is Still Murky

The Capital Spectator -

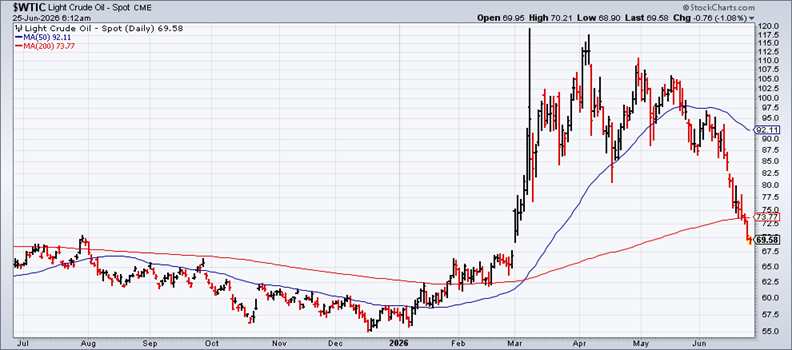
The price of the U.S. benchmark for crude oil fell below $70 a barrel on Wednesday, marking the lowest level since the war with Iran began on Feb. 28. The sharp slide will ease pressure on headline inflation measures in the coming months. The question is whether the bond market will soon follow suit, and price in lower inflation risk? Hanging in the balance is the outlook for Federal Reserve rate hikes.

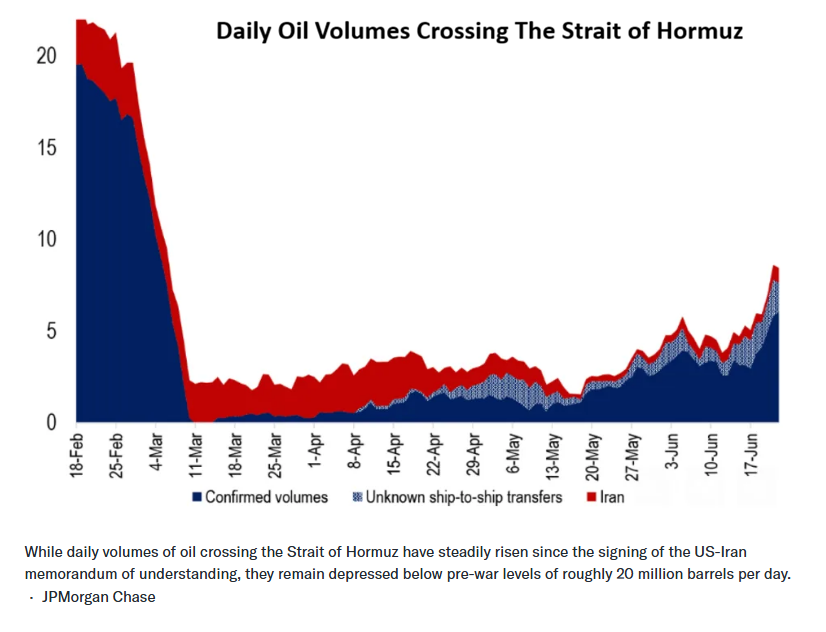
Weighing on oil prices is a preliminary deal to end the war with Iran, and shipping through the Strait of Hormuz is gradually recovering, although energy volumes remain far below pre-war levels. “What shippers are looking for is consistency over days and weeks,” says Matthew Wright, a freight analyst at Kpler, which analyzes global shipping.

The oil market is pricing in continued progress and a return to normal energy exports in the weeks and months ahead. “Traders are pricing in a return to normality,” says Francis Osborne, head of oil analysis at Argus Media, which tracks oil prices. “They are not taking into account the risks further down the road, which still remain very real.”

Despite the uncertainty that still hangs over the Middle East, Treasury yields have begun to pull back, although unevenly. The 30‑year yield, the most inflation‑sensitive maturity, fell sharply yesterday, dropping to 4.84%, the lowest level in several months. The benchmark 10‑year yield also declined, reversing the spike of the past month or so.

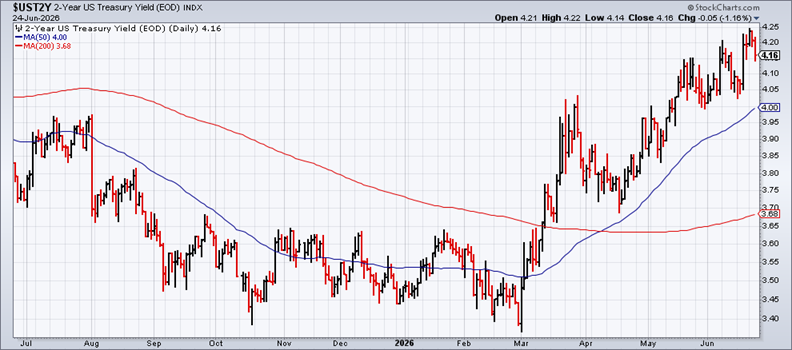
A notable exception is the policy‑sensitive 2‑year yield, which eased yesterday but at 4.16% remains close to its recent peak set just a few days earlier. The implication: the market isn’t fully persuaded that inflation risk has faded or that Fed rate hikes are unlikely.

Apollo Chief Economist Torsten Slok writes that lower oil prices could turn out to be inflationary, explaining:

The narrative in markets is changing from “lower oil prices mean lower inflation” to “lower oil prices mean more demand in an already overheating economy, which means higher inflation.” Driven by the strong April CPI, hot May non‑farm payrolls, and a hawkish Fed, the market narrative now suggests that the reopening of the Strait of Hormuz will further overheat the economy, forcing the Fed to raise interest rates soon.

Determining whether Slok’s outlook is accurate will take time, as uncertainty from geopolitical and macroeconomic risks cloud the outlook. In the immediate future, however, a degree of relief is expected for inflation.

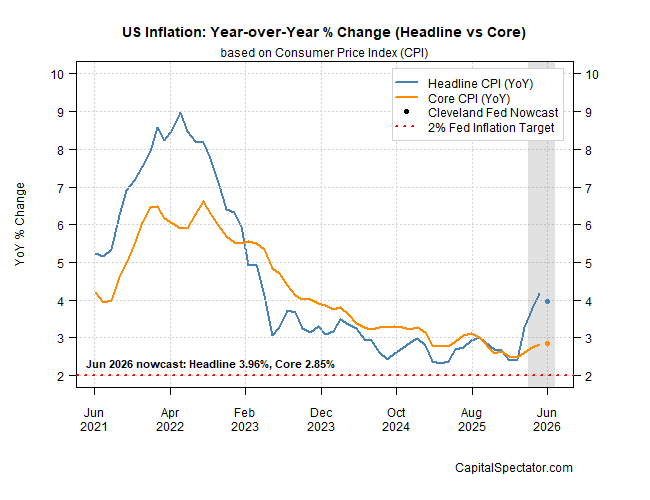
The Cleveland Fed’s nowcast for year‑over‑year CPI calls for a modest downshift after several months of hotter prints. Core CPI’s trend, which has remained relatively stable throughout the war—edging only slightly higher—is on track to rise 2.9% in this month’s update versus the year‑ago level.

Fed funds futures, however, are pricing in higher odds of rate hikes in the near term: a 34% probability of a ¼‑point hike at the next FOMC meeting on July 29, rising to 67% in favor of tightening in September.

Morningstar predicts that any lingering inflation in the near term will eventually fade. “We expect inflation to fall in the coming years. Receding energy prices will be reflected in a negative impulse to inflation in 2027. The tariff impact should also cease going forward. Moreover, wage growth has slowed considerably, which should help push services inflation back to normal. Housing inflation also continues to trend down.”

But for the moment, 2027 still feels far away. For now, markets are taking the win on cooling prices. But with the Fed’s path still unsettled, the calm may yet prove fleeting.

Is Recession Risk Rising? Monitor the outlook with a subscription to:
The US Business Cycle Risk Report

Getting a HELOC in Cumberland County? Here Are the Top Professionals You’ll Need

Money Under 30 -

Tapping into your home’s equity can open the door to renovations, debt consolidation, or achieving financial goals. As a homeowner, a home equity line of credit (HELOC) offers flexible access to funds based on your property value. Success depends on assembling the right team of local professionals, and this guide introduces the trusted HELOC lender […]

Global Bonds Stumble as Surging US Dollar Piles On the Pain

The Capital Spectator -

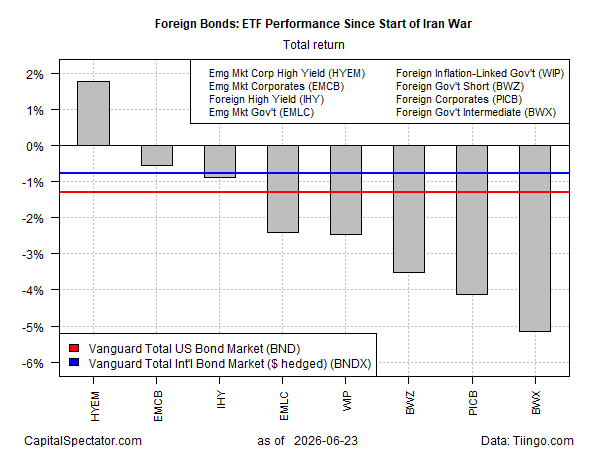
The Middle East conflict may have ended, but the damage lingers for foreign bonds from the perspective of US investors, based on a review of ETF performance from the start of the war on Feb. 28 through yesterday’s close (Jun. 23). The main headwinds: inflation worries and a rising US dollar.

Most segments of offshore bonds have lost ground since the war began, but one market stands out as a notable exception: high-yield fixed-income securities issued in emerging markets. The VanEck Emerging Markets High Yield Bond ETF (HYEM) has gained 1.8% since Feb. 28. That modest advance contrasts with broad losses across the rest of the field, led by a 5.2% decline in developed-market government bonds with intermediate maturities (BWX). Even the US investment‑grade benchmark (BND) has slipped, shedding 1.3% over the same period.

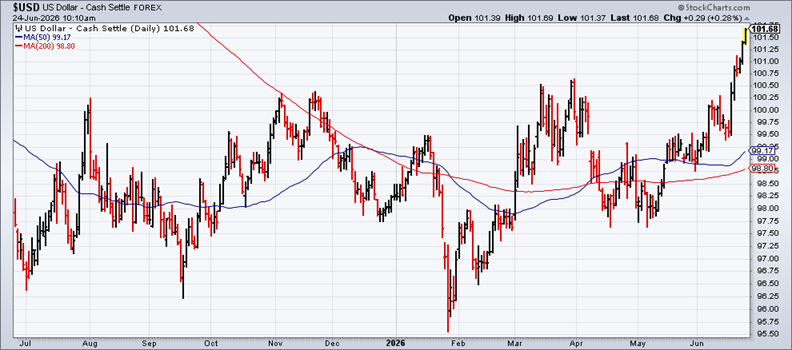
Dollar strength is a key driver of the weakness in foreign bonds. All else equal, a stronger greenback translates into lower prices for foreign assets when measured in US dollar terms.

The currency hit has been especially acute lately. The US Dollar Index—a basket of major currencies—climbed to a 13‑month high on Tuesday (Jun. 23).

Several forces are pushing the dollar higher. One is its lingering safe‑haven appeal. Despite its ups and downs in recent years, the Dollar Index’s rise since the war began suggests investors still view the currency as a refuge in times of geopolitical uncertainty.

Adding to the dollar’s appeal is the expectation that hotter inflation will persuade the Federal Reserve to raise interest rates, boosting the attractiveness of U.S. dollar cash equivalents.

Bank of America expects rate hikes ahead, projecting the current 3.50%–3.75% Fed funds target range will rise to 4.25%–4.50% by year‑end. Supporting the bank’s outlook: nine of the 18 FOMC members anticipate at least one rate increase in 2026, and Fed Chair Kevin Warsh’s hawkish tone at his debut press conference last week.

Christopher Hodge, chief US economist at Natixis, wrote that Warsh “was unambiguously hawkish and doubled down on the notion that ‘inflation is a choice.’ It is clear that inflation will be the focus for the Fed in the near term and that plenty of changes to process, analysis, and communication are afoot.”

Until markets are convinced that inflation risk is contained, relief for bonds—both in the US and abroad—will remain fragile.


What to Do When You Run Out of Money Before Your Next Paycheque

Money Under 30 -

Payday is still days away, and your bank account is scraping the bottom. If that scenario hits close to home, you’re far from alone. With the cost of living climbing steadily across Canada, running short before your next deposit has become a painfully common experience for young adults. Surveys on financial well-being consistently show that […]

Real Yields Rise Above 2%—Is the Market Doing the Fed’s Job?

The Capital Spectator -

The new Fed Chair, Kevin Warsh, wants the bond market to take the lead in pricing interest rates—effectively shifting more of the central bank’s traditional role to market forces. The ongoing rise in real (inflation‑adjusted) yields suggests investors are doing exactly that in response to the recent jump in inflation.

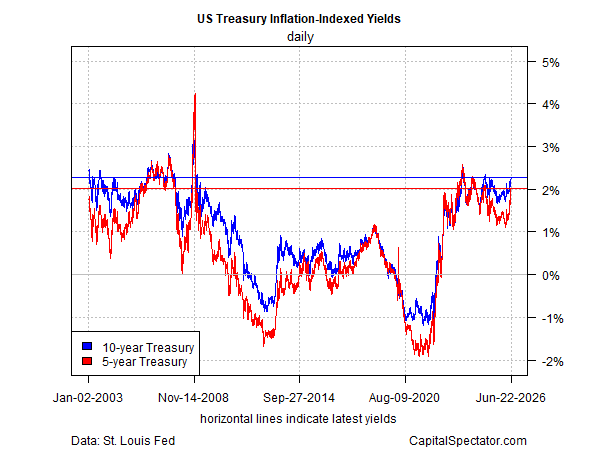
Consider real yields on Treasury Inflation‑Protected Securities (TIPS). At yesterday’s close, the 5‑year TIPS rate climbed to 2.01%, its first move above 2.0% in more than a year. That follows earlier breaks above the 2.0% threshold in longer maturities, including the 10‑year TIPS, now at 2.13%. At the far end of the curve, the 30-year TIPS yield is 2.75%.

By the standards Warsh laid out last week at his first press conference as Fed chair, higher real yields are part of the plan. In remarks widely interpreted as hawkish, he said that “inflation has been running well ahead of the Fed’s long‑stated inflation goal of 2%—that’s been going on for more than five years. Persistently high prices are a burden for the American people.”

The rise in real yields above 2% suggests the market is recalibrating and signaling that tighter policy may be needed. Warsh appears comfortable with that shift. As he put it last week: “I think financial markets perform best when they react to incoming data.”

Given the hotter inflation readings, higher real yields are the natural response. “The more that markets are paying attention to what’s happening in the real economy—deciding what’s good data and what’s less good data—the more financial markets can price what they believe is the most likely and what the tail risks are,” Warsh explained.

For investors, the chance to lock in real yields above 2% makes TIPS more appealing. As recently as Feb. 27, the 5‑year real yield was just 1.11%. But the war with Iran, which pushed up energy prices and inflation, has driven real yields sharply higher.

How long these elevated real yields persist, or rise further, is uncertain. While headline inflation is running much hotter because of the war, core inflation has been more subdued, giving the Fed room to consider whether rate hikes are actually necessary.

Fed funds futures are beginning to price in higher odds of hikes at upcoming meetings. But with Vice President Vance reporting “great progress” in talks with Iran, the conflict’s endgame coming into view, and energy prices falling, it’s unclear how much further real yields can rise without a new catalyst to worry the bond ghouls.


Why an AI Email Marketing Assistant Is Becoming Essential for the Modern Marketing Team 

Money Under 30 -

Marketing teams face pressure to deliver personalized, high-performing email campaigns at a pace that manual processes can’t sustain. As email remains one of the better return-on-investment (ROI) channels, the gap between what audiences expect and what teams can deliver continues to widen. As such, AI email marketing assistants like Emma bridge that gap by automating […]

Q2 GDP Nowcast Steady at 2.5% as US–Iran Talks Progress

The Capital Spectator -

The US–Iran conflict appears to be winding down, but even if such optimism is premature, the American economy remains on track to post a stronger growth rate in the upcoming second-quarter GDP report.

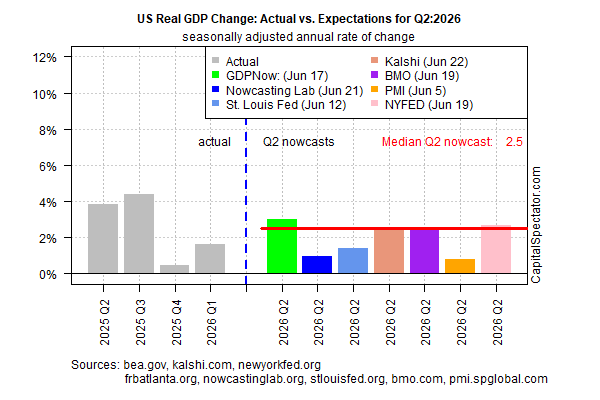
Output growth for Q2 is currently estimated at 2.5% (real annualized rate), based on the median for a set of nowcasts compiled by The Capital Spectator. The estimate translates to a solid rebound in growth following the 1.6% increase in Q1.

Today’s update is unchanged from our previous median 2.5% growth estimate for Q2. The recent stability in the data provides a degree of confidence in expecting a faster pace of growth in the April-through-June period.

Reports that the US and Iran concluded talks in Switzerland today for “a roadmap” to reach a final deal in 60 days offer fresh hope that the Middle East crisis has peaked and will be a fading headwind for global growth. In turn, that opens the door to a gradual rebound in energy exports from the Gulf and provides relief from the recent inflation surge that has threatened to derail the global economy.

The durability of any deal remains to be seen, but even if fighting flares up again, the US economy at this point appears poised to extend its reacceleration from the near-stagnant rate of growth in last year’s Q4.

Early in the war, some economists warned that the conflict would quickly lead to recessionary conditions in the US. But those fears proved to be ill‑founded. Nowcast updates on these pages throughout the conflict routinely highlighted resilience in Q2 GDP estimates – see here and here, for example.

Similarly, The Capital Spectator’s business‑cycle model in recent months has consistently estimated a low probability that the start of an NBER‑defined downturn was near.

The US–Iran peace may be precarious, but today’s news of “encouraging progress” lay the groundwork for a kinder, gentler macro outlook in the near term. Even if the optimism proves illusive or premature, the latest numbers suggest that the US will still report a relatively upbeat GDP result for Q2 in next month’s official update from the Bureau of Economic Analysis.

Is Recession Risk Rising? Monitor the outlook with a subscription to:
The US Business Cycle Risk Report

Pages