Feed aggregator

Why Walking Away From Financial Issues Can Cost You More Later

Money Under 30 -

Taking financial losses can hurt you in ways that extend beyond the original issue. If you’re used to absorbing the cost of wage theft, workplace injuries, contract violations, or fraud without taking action, you could be looking at serious financial consequences that continue for years. For instance, medical debt will grow, damaged credit can limit […]

Trailing Yields: Major Asset Classes | 4 June 2026

The Capital Spectator -

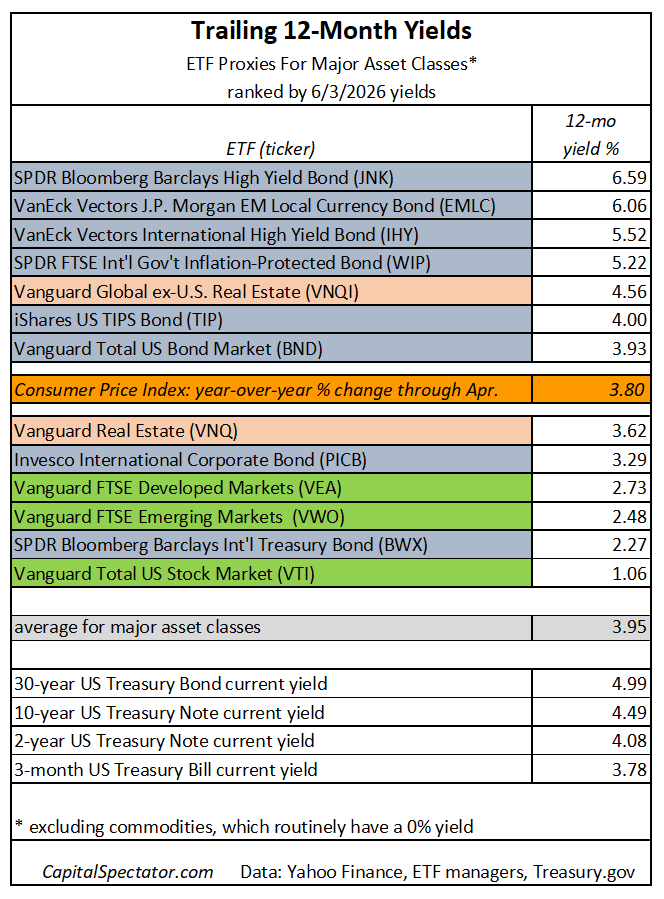
US junk bonds continue to post the highest trailing one‑year yields for the major asset classes, based on a set of ETFs through June 3. Roughly half of the funds are reporting payout rates above the current pace of annual consumer inflation.

The 6.59% trailing yield for the SPDR High Yield Bond ETF (JNK) remains the payout leader. On the opposite end of the spectrum, US stocks (VTI) are posting the lowest yield at 1.06%.

The highest‑yielding asset classes offer trailing yields above Treasuries, which top out at 4.99% for the 30‑year maturity.

For comparison, consumer inflation is running at 3.80% on an annual basis through April. Using that benchmark, about half of the major asset classes are generating positive real yields. The average trailing yield across all asset classes is 3.95%, slightly above the current inflation rate.

For readers eyeing these yields as a basis for asset allocation, the usual caveats apply. Trailing payout rates may or may not persist. Unlike the ability to lock in current yields on government bonds through a buy‑and‑hold strategy, historical payout rates for risk assets—such as those delivered via ETFs—can be misleading in real time because both payout amounts and share prices fluctuate. The table above is presented as a first step for comparing yields and considering how to structure a portfolio when the goal focuses on generating income.

One reason to be cautious when reviewing trailing yield is the ever‑present risk that whatever you earn in payouts from ETFs could be offset—or more than offset—by declining share prices. That’s why it’s essential to consider total‑return expectations when evaluating yield opportunities. For perspective on forward‑looking performance, you can start with the monthly updates of CapitalSpectator.com’s long‑term outlook for major asset classes.

The opportunity to earn yields above the “risk‑free” payout rates on US Treasuries may look appealing, but relatively high yields generally signal higher risks. That doesn’t mean it’s misguided to build a portfolio designed to maximize yield, but it’s rarely, if ever, a free lunch.

Learn To Use R For Portfolio Analysis
Quantitative Investment Portfolio Analytics In R:
An Introduction To R For Modeling Portfolio Risk and Return

By James Picerno

Energy Shock Looms, but Q2 GDP Still Looks Surprisingly Strong

The Capital Spectator -

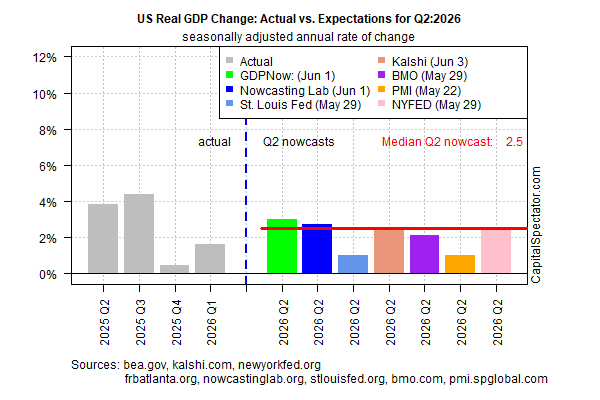
The US economy isn’t immune to the energy shock continuing to reverberate from the Middle East, but the fallout may be hard to spot in the upcoming second‑quarter GDP report. That, at least, is the message in current nowcasts.

Output is projected to rise 2.5% in Q2, based on the median nowcast from a set of estimates compiled by CapitalSpectator.com. If correct, the Q2 report (scheduled for July 30) will mark a moderately stronger gain than the 1.6% increase in Q1.

Recent Q2 nowcasts have been stable, holding in the 2%-plus range. Today’s 2.5% estimate is up slightly from the previous 2.4% nowcast on May 21.

The concern is that deeper economic pain for the US has only been delayed rather than avoided. A prominent economic bear—Moody’s chief economist Mark Zandi—says the spike in oil prices has raised recession risk. Without a deal with Iran to reopen energy exports through the Strait of Hormuz, gas prices could soon top $5 a gallon, which he predicts would lead to lower consumer spending and an economic downturn. Writing on social media last week, he said:

Consumers are running out of financial resources to maintain their spending, which stalled out last month. And then, of course, there is the surge in inflation, which is closing in on 4%, double the Federal Reserve’s target. And all of this comes after massive deficit‑financed tax cuts, which are now fading fast. The Iran war needs to end, and the Strait of Hormuz needs to be reopened soon, or recession will become more likely than not.

HFI Research, an energy research firm, predicts: “By the end of June, if the Strait of Hormuz is still closed, global oil inventory operational minimum is guaranteed.”

The latest news from the Gulf isn’t encouraging. The US and Iran have launched new strikes, raising fresh uncertainty about the prospects for peace talks.

When and how the ongoing conflict and disruption to energy supplies will affect the US economy remains unclear. For now, at least, the effects on GDP nowcasts appear minimal. US growth is probably slower than it otherwise would have been absent the war, but recession risk remains low for the moment. The next move—up or down— in the nowcasts may depend on how long the energy bottleneck lasts.


Total Return Forecasts: Major Asset Classes | 2 June 2026

The Capital Spectator -

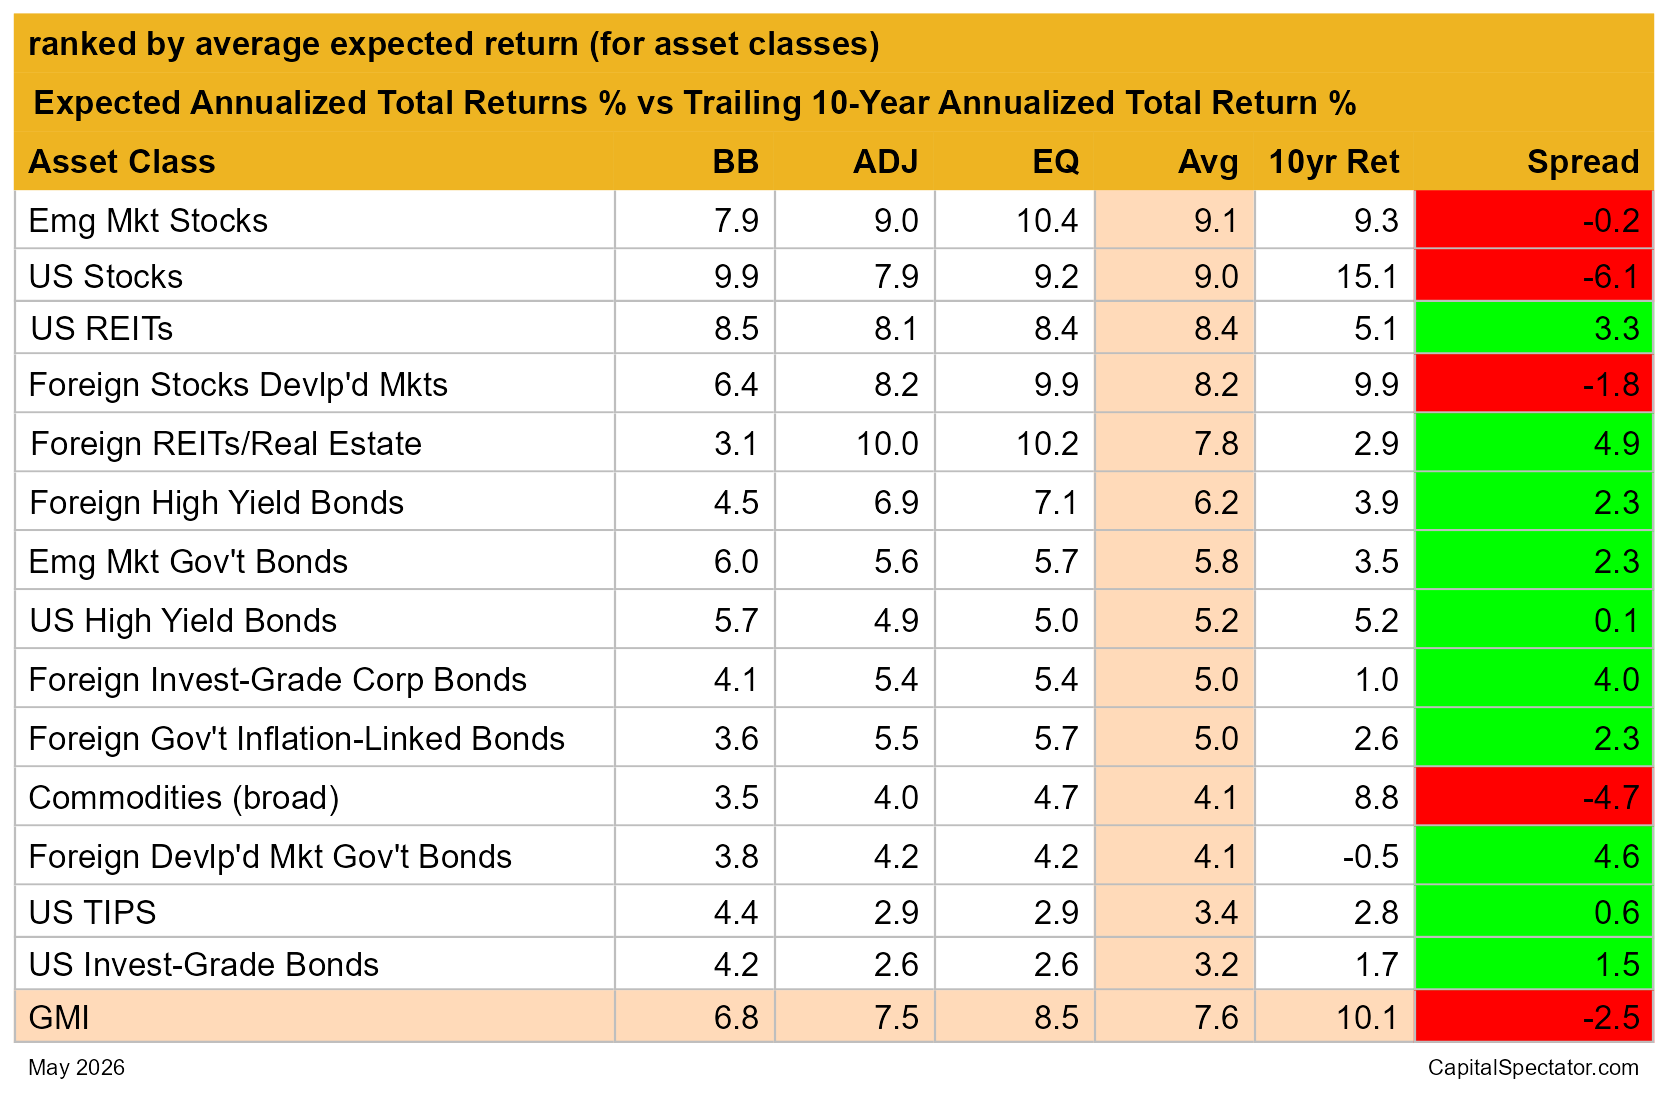
The expected long-term total return for the Global Market Index (GMI) continued to tick higher in May, rising to the highest level in recent history. Although the annualized performance outlook has edged up to a mid-7% forecast, the current outlook remains well below GMI’s realized return over the trailing ten-year window.

GMI is a market-value-weighted mix of the major asset classes (excluding cash) via ETF proxies. Today’s long-run outlook is calculated as the average of three models (defined below). The current 7.6% annualized estimate for GMI ticked up from last month’s estimate, but is still substantially below the trailing 10.1% annualized return that GMI has generated over the past decade.

In line with recent history, about a third of GMI’s components are projected to generate returns below their respective results over the past ten years (indicated by the red boxes in the far-right column below). GMI expected performance is also subpar vs. its trailing ten-year history through May: 7.6% vs. 10.1%.

GMI represents a theoretical benchmark for the “optimal” portfolio that’s suited for the average investor with an infinite time horizon. Accordingly, GMI is useful as a starting point for customizing asset allocation and portfolio design to match a particular investor’s expectations, objectives, risk tolerance, etc. GMI’s history suggests that this passive benchmark’s performance will be competitive with most active asset-allocation strategies, especially after adjusting for risk, trading costs and taxes.

It’s likely that some, most or possibly all of the forecasts above will be wide of the mark in some degree. GMI’s projections, however, are expected to be somewhat more reliable vs. the estimates for its  components. Predictions for the specific markets (US stocks, commodities, etc.) are subject to greater variability compared with aggregating the forecasts into the GMI estimate, a process that may reduce some of the errors through time.

Another way to view the projections above is to use the estimates as a baseline for refining expectations. For instance, the point forecasts above can be adjusted with additional modeling that accounts for other factors and assumptions not used here. Customizing portfolios for a specfic investor, to reflect risk tolerance, time horizon, and so on, is also recommended.

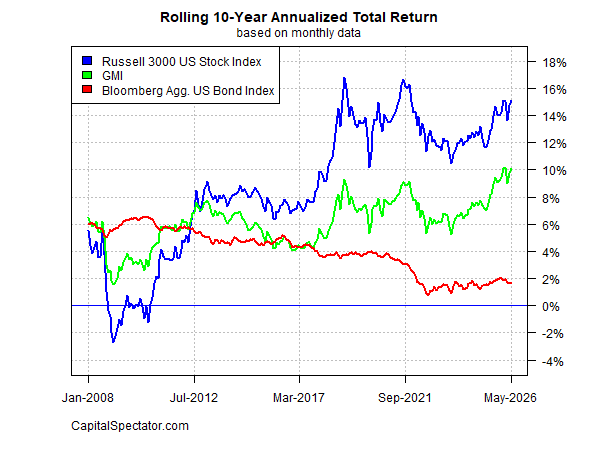
For perspective on how GMI’s realized total return has evolved through time, consider the benchmark’s track record on a rolling 10-year annualized basis. The chart below compares GMI’s performance vs. ETFs tracking US stocks and US bonds through last month. GMI’s current return for the past ten years is a robust annualized 10.1%.

Here’s a brief summary of how the forecasts are generated and definitions of the other metrics in the table above:

BB: The Building Block model uses historical returns as a proxy for estimating the future. The sample period used starts in January 1998 (the earliest available date for all the asset classes listed above). The procedure is to calculate the risk premium for each asset class, compute the annualized return and then add an expected risk-free rate to generate a total return forecast. For the expected risk-free rate, we’re using the latest yield on the 10-year Treasury Inflation Protected Security (TIPS). This yield is considered a market estimate of a risk-free, real (inflation-adjusted) return for a “safe” asset — this “risk-free” rate is also used for all the models outlined below. Note that the BB model used here is (loosely) based on a methodology originally outlined by Ibbotson Associates (a division of Morningstar).

EQ: The Equilibrium model reverse engineers expected return by way of risk. Rather than trying to predict return directly, this model relies on the somewhat more reliable framework of using risk metrics to estimate future performance. The process is relatively robust in the sense that forecasting risk is slightly easier than projecting return. The three inputs:

* An estimate of the overall portfolio’s expected market price of risk, defined as the Sharpe ratio, which is the ratio of risk premia to volatility (standard deviation). Note: the “portfolio” here and throughout is defined as GMI

* The expected volatility (standard deviation) of each asset (GMI’s market components)

* The expected correlation for each asset relative to the portfolio (GMI)

This model for estimating equilibrium returns was initially outlined in a 1974 paper by Professor Bill Sharpe. For a summary, see Gary Brinson’s explanation in Chapter 3 of The Portable MBA in Investment. I also review the model in my book Dynamic Asset Allocation. Note that this methodology initially estimates a risk premium and then adds an expected risk-free rate to arrive at total return forecasts. The expected risk-free rate is outlined in BB above.

ADJ: This methodology is identical to the Equilibrium model (EQ) outlined above with one exception: the forecasts are adjusted based on short-term momentum and longer-term mean reversion factors. Momentum is defined as the current price relative to the trailing 12-month moving average. The mean reversion factor is estimated as the current price relative to the trailing 60-month (5-year) moving average. The equilibrium forecasts are adjusted based on current prices relative to the 12-month and 60-month moving averages. If current prices are above (below) the moving averages, the unadjusted risk premia estimates are decreased (increased). The formula for adjustment is simply taking the inverse of the average of the current price to the two moving averages. For example: if an asset class’s current price is 10% above its 12-month moving average and 20% over its 60-month moving average, the unadjusted forecast is reduced by 15% (the average of 10% and 20%). The logic here is that when prices are relatively high vs. recent history, the equilibrium forecasts are reduced. On the flip side, when prices are relatively low vs. recent history, the equilibrium forecasts are increased.

Avg: This column is a simple average of the three forecasts for each row (asset class)

10yr Ret: For perspective on actual returns, this column shows the trailing 10-year annualized total return for the asset classes through the current target month.

Spread: Average-model forecast less trailing 10-year return.



Major Asset Classes | May 2026 | Performance Review

The Capital Spectator -

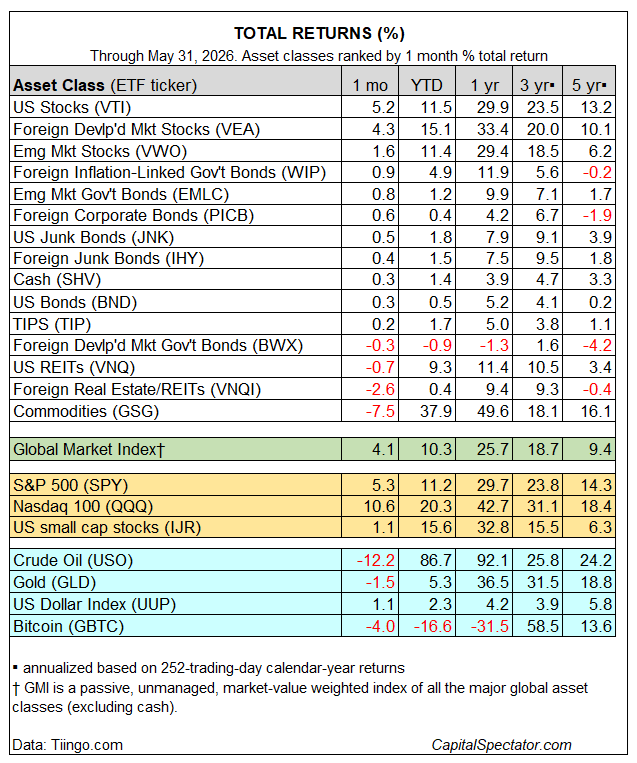
Most markets continued to rise in May, extending April’s bounce-back after March’s broad and deep selloff, based on a set of ETFs. The main exception among the major asset classes: commodities, which fell sharply, posting the first monthly decline this year.

US stocks led the rally in May: Vanguard Total US Stock Market ETF (VTI) rose 5.2%, the fund’s strongest monthly gain in a year. Developed-market equities ex-US (VEA) posted a solid second-place performance, advancing 4.3% and marking a second-straight monthly increase.

US bonds (BND) edged higher for a second month. Inflation-indexed Treasuries (TIP) also moved higher again in May. Notably, TIP is outperforming the broad US fixed-income benchmark (BND) so far in 2026 by more than a percentage point: 1.7% vs. 0.5%.

The main loser last month: a broad measure of commodities (GSG), which fell 7.5%. Despite the setback, commodities are still the leading performer for the major asset classes, clocking in with a near-38% rally in 2026.

All but one of the major asset classes are posting year-to-date gains. The only red ink on the ledger for 2026: governments bonds in developed markets ex-US (BWX) are off 0.9% for the year.

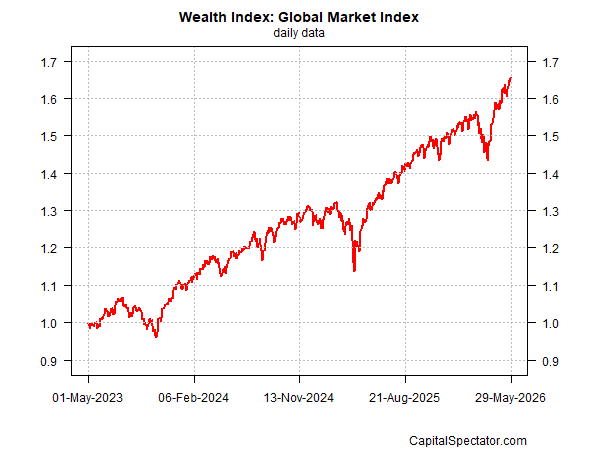
The Global Market Index (GMI) rallied again in May, rising 4.1% and extending its winning streak to 13 of the past 14 months.  GMI is an unmanaged benchmark (maintained by The Capital Spectator) that holds all the major asset classes (except cash) in market-value weights via ETFs and serves as a competitive benchmark for globally diversified, multi-asset-class portfolio strategies.


A Guide to Lowering Your Warehousing Costs and Boosting Profit Margin

Money Under 30 -

Warehousing costs can creep up without anyone noticing. And before you know it, the quarterly numbers land, and the margins are thinner than expected. But there’s usually a silver lining behind this: Most warehouse operations have meaningful room to reduce costs without sacrificing throughput or service quality.  Not sure where to start? Here are a […]

What Young Professionals Should Know Before Relocating

Money Under 30 -

Moving to a new city feels like flipping a page. For a lot of young professionals, it shows up as this strange cocktail of ambition, nerves, excitement, and a quiet voice in the back of your head asking whether you’ve really thought this through. Maybe the move is for a better job. Maybe it’s for […]

Off the Grid, Italy Edition…

The Capital Spectator -

The Capital Spectator is taking an extended Memorial Day holiday and trading NJ for Italy for the week ahead. Postings will be light to (probably) non-existent during the interim. The US-based routine resumes again on June 2. Ciao!

Book Bits: 23 May 2026

The Capital Spectator -

Yuppies: The Bankers, Lawyers, Joggers, and Gourmands Who Conquered New York
Dylan Gottlieb
Review via The Wall Street Journal
“Violent gentrification” is an eye-catching phrase akin to “Canadian depravity” or “Luxembourgish aggression.” If it exists, it isn’t obvious. In “Yuppies: The Bankers, Lawyers, Joggers, and Gourmands Who Conquered New York,” Dylan Gottlieb does his best to alarm readers about his subject and their nefarious doings, such as moving into dicey neighborhoods and turning them into havens for fragrant bakeries and adorable cafes.
The term “yuppie” is as closely tied to the 1980s as “hippie” is to the ’60s. Young urban professionals have usually been discussed in comic terms, by such writers as Tom Wolfe and P.J. O’Rourke, with gentle mockery or even wry affection. Mr. Gottlieb, a professor of history at Bentley University, produces nearly 300 pages on the topic without a trace of humor, except in quotation.
The Almighty Dollar: 500 Years of the World’s Most Powerful Money
Brendan Greeley
Interview with author via Marketplace.org
When it comes to the global financial system, you can’t really beat the dollar. It’s the dominant global reserve currency, making up over half of the foreign reserves held by central banks around the world. But how did the dollar become so important?
While you could say it goes back to the 1944 Bretton Woods Conference, the answer might predate that. In his new book, “The Almighty Dollar: 500 Years of the World’s Most Powerful Money,” journalist and financial history academic Brendan Greely suggests the dollar’s rise is partially due to the philosophy of money and also the history of the American banking system.
“To understand why American bank dollars had value, we have to go back a little farther [than Bretton Woods],” said Greeley. “We had banking panics every 15 years or so in the 19th century. After each one of these banking panics, we end up with regulation.”

How to Rule the World: An Education in Power at Stanford University
Theo Baker
Summary via publisher (Penguin Press)
From Theo Baker, winner of the George Polk Award for his investigation that brought down Stanford’s president, comes a revelatory and gripping account of Silicon Valley hubris. Slush funds. Shell companies. Yacht parties. This is life for Silicon Valley’s favored teenagers. Seventeen-year-old Theo Baker showed up for freshman year at Stanford University as a tech-obsessed coder. It seemed like paradise. There were Rodin sculptures next to nuclear laboratories and inventors lounging with Olympians. But Baker soon discovered a culture that embraced corner-cutting, that vested infinite excess and access in the hands of kids with few safeguards to catch bad behavior. Stanford, he realized, was less a school than a business.

Steve Jobs in Exile: The Untold Story of NeXT and the Remaking of an American Visionary
Geoffrey Cain
Excerpt via Vanity Fair
“I’m asking Steve to step down,” Apple CEO John Sculley told the company’s board of directors, “and you can back me on it . . . or you’re going to have to find yourselves a new CEO.”
It was April 11, 1985, and long-simmering tensions between John Sculley and Steve Jobs had finally erupted. It marked a stunning reversal. Just two years earlier, Steve had handpicked and personally recruited John from PepsiCo. Apple had grown into a billion-dollar company, and Steve, along with the board, felt that John would be the right person to provide the company with “adult supervision” as its CEO. After John joined, Steve remained chairman of the board and head of the Macintosh unit, where he led the development of the company’s flag- ship personal computer.

Please note that the links to books above are affiliate links with Amazon.com and James Picerno (a.k.a. The Capital Spectator) earns money if you buy one of the titles listed. Also note that you will not pay extra for a book even though it generates revenue for The Capital Spectator. By purchasing books through this site, you provide support for The Capital Spectator’s free content. Thank you!

Headline Inflation Surges, but Core Measures Keep the Fed on Hold

The Capital Spectator -

Inflation has climbed in the wake of the energy shock stemming from the Middle East, and economists expect the upward pressure to persist in the months ahead. The Federal Reserve is monitoring the data closely, but it left interest rates unchanged at its most recent policy meeting late last month. The Fed funds futures market is still assigning high odds to the Fed holding steady at the next several meetings. The question now is how high inflation will rise before the central bank feels compelled to resume rate hikes.

One reason the Fed prefers to wait before tightening policy is the relatively stable pace of inflation in the so‑called core measures of pricing pressure. Although headline inflation—which includes food and energy—has turned sharply higher since the war began, core measures have remained comparatively steady.

The case for central banks focusing on core inflation is that these measures provide a more reliable read on underlying trends, offering a more practical benchmark for setting monetary policy. Not everyone agrees with this approach, but as long as core inflation remains stable, the Fed can argue that additional rate hikes aren’t yet warranted.

The Fed reportedly emphasizes the core Personal Consumption Expenditures (PCE) Price Index, which tracks changes in the price of goods and services purchased by households, excluding the more volatile categories of food and energy. But several variations of core inflation exist, and monitoring a range of alternatives can provide a clearer sense of how conditions are evolving—and how those changes may influence the timing of future rate increases.

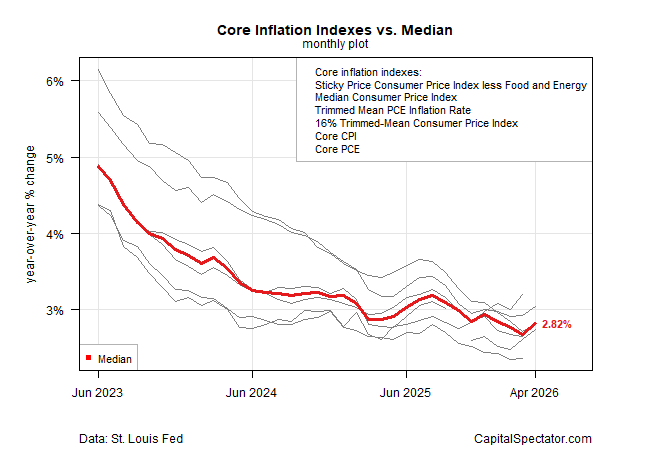
For context, the chart below highlights the median year‑over‑year change for six core inflation indexes. Each index has its own strengths and weaknesses—see the links at the end of this article for details. It’s debatable whether any single measure is superior, so tracking the median is a useful starting point. In April, the median rose to 2.82% from a year earlier, still close to the softest pace in recent history.

The main takeaway is that while core inflation edged higher in April, the broader trend has yet to flash a warning—unlike the sharper increases seen in headline inflation.

It remains unclear when, or if, the Fed will begin raising interest rates in response to the ongoing energy shock from the Middle East. But if the core measures shown above continue to drift higher, pressure for tighter policy will almost certainly grow.

Sticky Price Consumer Price Index less Food and Energy

Median Consumer Price Index 

Trimmed Mean PCE Inflation Rate

16% Trimmed-Mean Consumer Price Index

Consumer Price Index less Food and Energy

PCE less Food and Energy


US Growth Nowcast for Q2 Holds Firm as Inflation Risks Mount

The Capital Spectator -

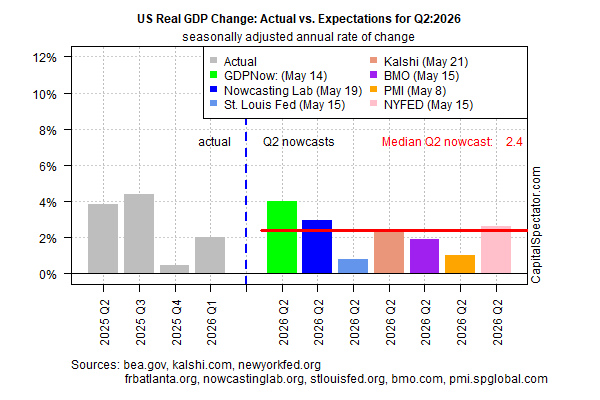
US economic growth remains on track to post a modestly stronger increase in the second quarter compared with Q1, according to the median nowcast from a set of estimates compiled by CapitalSpectator.com. Despite heightened inflation risks stemming from the Middle East energy shock, output appears relatively resilient so far for GDP in the current quarter.

Today’s update of the median Q2 nowcast indicates real (inflation-adjusted) growth of 2.4%, moderately above Q1’s 2.0% advance. If accurate, the Q2 report (scheduled for July) will reflect a continued, albeit modest, recovery following the weak gain in Q4.

Today’s estimate is slightly above the previous median nowast: 2.2%, published on May 11.

Economists at the Royal Bank of Canada write: “The energy shock isn’t likely to trigger a US recession in 2026,” noting that “the set of indicators used by the National Bureau of Economic Research to identify recessions is not flashing red. Yes, some segments suggest caution, but more recent data—including payroll growth, industrial production, and retail sales—are accelerating, while the unemployment rate is holding steady.”

The main caveat is that it is still early to fully assess the inflation risk from the supply‑side energy shock, which continues to reverberate across the global and US economies.

Minutes from the most recent Federal Reserve policy meeting reveal that a majority of Fed officials discussed the possibility of interest rate hikes if the Iran war continued to raise inflation. Although members of the Federal Open Market Committee differed on how long the conflict might last and how much inflation risk it could pose, “a majority of participants highlighted, however, that some policy firming would likely become appropriate if inflation were to continue to run persistently above 2 percent.”

Last week’s consumer inflation report for April showed a second consecutive month of hotter pricing pressure. Headline CPI’s year‑over‑year increase accelerated to 3.8%, a three‑year high and further above the Fed’s 2% inflation target.

Inflation is expected to rise further, according to a survey of economists published by the Philadelphia Fed last week. Headline CPI is projected to briefly spike to 6.0% in the second quarter before easing later in the year.

If the Fed raises interest rates to combat inflation, the policy shift could create a new headwind for the economy. So far, those headwinds appear mild, based on cuerrent headline GDP estimates for Q2. But with Gulf energy exports still blocked, and no resolution expected in the immediate future, the extent of inflation risk—and how the economic effects will unfold in the months ahead—remains uncertain.

Is Recession Risk Rising? Monitor the outlook with a subscription to:
The US Business Cycle Risk Report

Real Yields Near 20-Year Highs As Energy Shock Continues

The Capital Spectator -

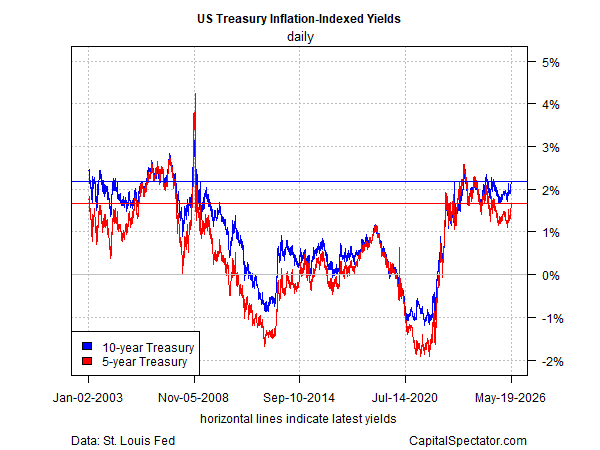
The 10‑year real US Treasury yield is hovering near a 20‑year high, with the 5‑year not far behind. Whether this is a good moment to lock in inflation‑indexed yields may hinge on how the Gulf crisis evolves in the months ahead.

The recent surge in Treasury yields has strengthened the case for holding bonds, and real yields are no exception. After years of volatility—including a plunge into negative territory during the pandemic followed by a sharp rebound driven by the Federal Reserve’s rate hikes—real yields are now back in ranges last seen two decades ago. The 10‑year TIPS yield stands at 2.18%, offering a guaranteed real return if held to maturity.

That’s an appealing level by historical standards. For comparison, the nominal 10‑year yield (without inflation protection) reached 4.67% on May 19, implying a market‑based inflation expectation of 2.49%—near a three‑year high, though below the brief 3.0% peak in 2022.

Whether it makes sense to lock in today’s real yields depends on where rates go next, and that path is unusually uncertain. The dominant near‑term driver remains the Middle East crisis.

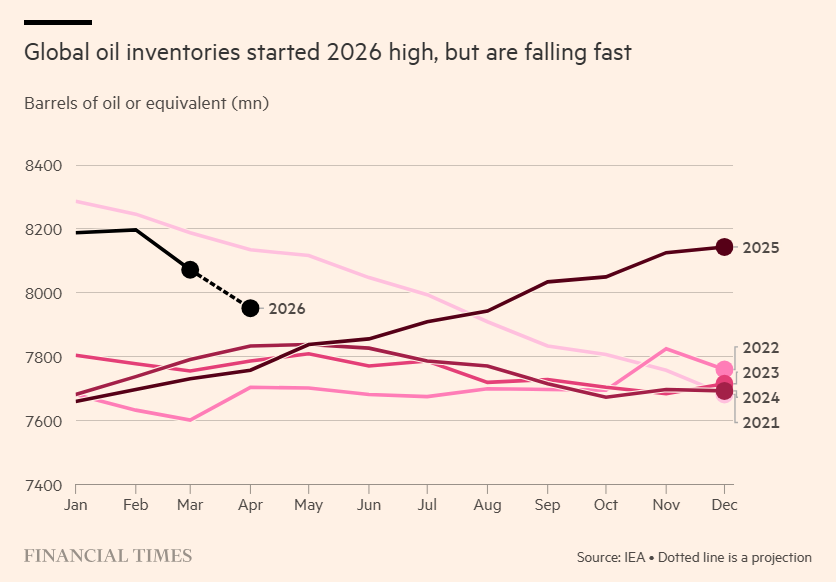
A rapid resolution that reopens the Strait of Hormuz and restores energy flows would likely ease inflation fears and push yields lower. But that outcome still appears unlikely. Fatih Birol, head of the International Energy Agency, warned Monday that commercial oil inventories are falling quickly, with only weeks of supply left as the Iran war and the Strait’s closure choke shipments. Strategic reserves have helped offset lost exports, but, as he noted, they “are not endless.”

Global inventory data suggests the supply‑demand squeeze will worsen if the stalemate persists, according to a chart from the Financial Times.

Meanwhile, geopolitical tensions remain high. President Trump said Monday he was “an hour away” from ordering new strikes on Iran before Gulf allies urged restraint. Iran’s Revolutionary Guard responded that any renewed attacks by the US or Israel would expand the conflict “beyond the region,” with retaliation in “places you cannot imagine,” according to Mehr News.

In a worst‑case scenario—renewed war, higher energy prices, and rising inflation—the bond market would likely demand an even higher risk premium, pushing yields up further. In a best‑case scenario—de‑escalation and resumed exports—yields could fall.

Given the uncertainty in the current climate, it’s difficult to predict the path ahead with confidence. That argues for a balanced approach: allocating part of a bond portfolio to TIPS to capture elevated real yields while keeping some cash available to respond to further market stress.

Unless one is unusually confident about both the outcome and timing of events in the Middle East, hedging across multiple scenarios has rarely looked more sensible.

Is Recession Risk Rising? Monitor the outlook with a subscription to:
The US Business Cycle Risk Report

How to Read “Market Sentiment” Data to Time Your Next Investment

Money Under 30 -

Investors treat markets like rational machines. Yet anyone who has spent time watching markets closely knows that apart from economic growth, inflation, and rate cuts, there is one important element that affects the whole system: emotion That is where market sentiment enters the conversation. Sentiment indicators attempt to measure how investors feel rather than simply […]

Rising Misery Index Signals Mounting Economic Pressure

The Capital Spectator -

Economic headwinds continue to reverberate from the conflict in the Middle East, but the US economy has proven relatively resilient in the wake of this macro shock. How long that resilience lasts is unclear, but the pressures are building. That’s a worrisome sign as the stalemate between the US and Iran continues and energy exports from the Gulf remain blocked.

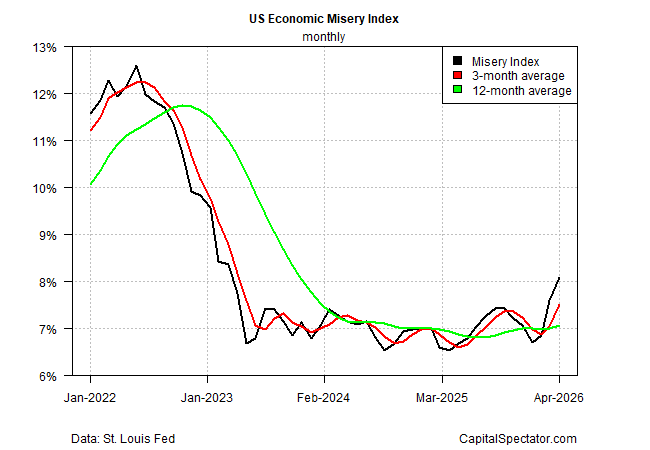
A useful proxy for estimating the potential for economic fallout is the so‑called Misery Index, which combines the inflation rate with the unemployment rate—a measure of the economic well‑being of the average consumer. By this benchmark, the war’s blowback is rising. April’s sum of the one‑year change in the consumer price index and the jobless rate rose to 8.1%, the highest in three years.

All of the recent upturn is due to hotter inflation over the past two months. The unemployment rate, by contrast, has remained steady at a modest 4.4%. Inflation appears likely to trend higher as the supply‑side energy shock continues, and so even a modest increase in the jobless rate could intensify the Misery Index’s increase this summer.

For now, another bullet has been dodged this week. President Trump said Monday that he had canceled what he described as a planned US strike on Iran scheduled for Tuesday. He explained that he halted the operation because “serious negotiations” were underway toward a peace agreement that he claimed would satisfy the United States and its Middle Eastern partners. Yet the very fact that a military attack was being prepared—and called off only at the last moment—underscores how far the two countries remain from any durable resolution.

Unsurprisingly, inflation is expected to trend higher in the upcoming report for May. The Cleveland Fed’s nowcast indicates that headline CPI will top 4% for the annual change for this month. Assuming the jobless rate holds steady, the CPI nowcast points to another rise in the Misery Index for May.

Optimists can point to core CPI, which has increased at a much softer pace, ticking up to 2.7% for the year through last month. The Federal Reserve pays more attention to core inflation metrics, which tend to provide a more robust measure of inflation’s trend compared to noisy headline indexes.

The problem is that while core CPI gives the Fed space to maintain a wait‑and‑see position on whether to tighten monetary policy, consumers are already feeling the pain of the war’s effects. In today’s hyper‑charged political climate, it’s an open question whether central bankers will remain immune to events on Main Street.

The recent history of the Misery Index suggests there are limits to that immunity. In 2021 and 2022, the index was soaring, peaking at 12.6% in May 2022, two months after the Fed started hiking interest rates.

The current Misery Index is still well below the previous peak, but the gap is narrowing, and the geopolitical news from the Gulf suggests more of the same is coming in the near term. History doesn’t repeat, but it’s getting easier to argue that it’s starting to rhyme… again.

Is Recession Risk Rising? Monitor the outlook with a subscription to:
The US Business Cycle Risk Report

As Inflation Heats Up, the Bond Market Loses Its Cool

The Capital Spectator -

The bond market will be the center of attention for investors this week as they assess how much inflation risk is lurking. Official reports already highlight accelerating pricing pressures, driven by Middle East turmoil that has lifted energy costs and raised headline measures of inflation. The debate is whether the run‑up in inflation is temporary or reflects a shift that will persist. Bound up with that question is how the Federal Reserve should respond.

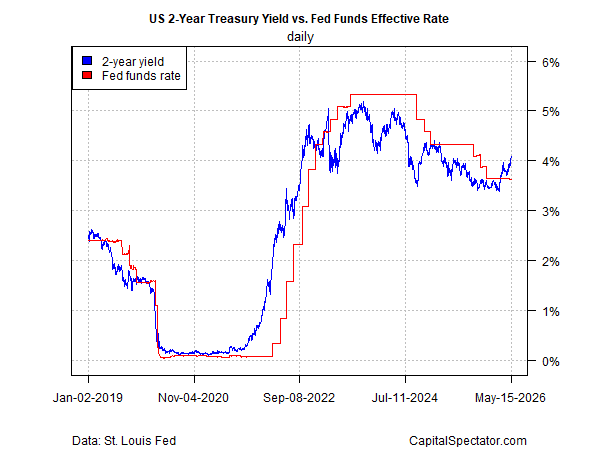
The Treasury market has already decided that tighter monetary policy is necessary. The policy‑sensitive 2‑year yield soared last week, rising above 4.0% for the first time in nearly a year. The jump is a sign that the bond market expects a hawkish pivot from the Fed.

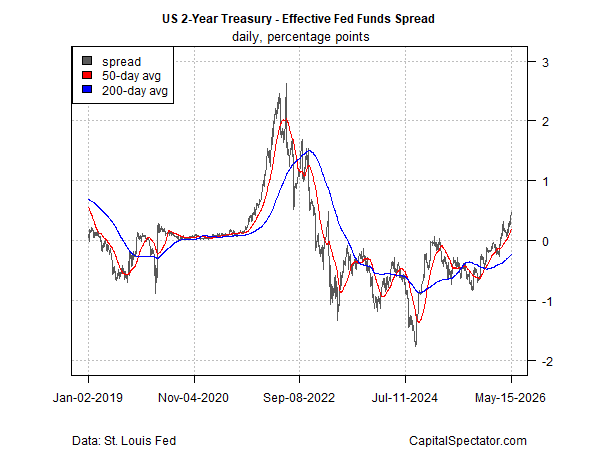
For a clearer view of how market conditions have changed, the chart below shows the spread between the 2‑year yield and the effective Fed funds rate (the volume‑weighted median of overnight Federal funds transactions). This gap has increased to a three‑year high—nearly half a percentage point.

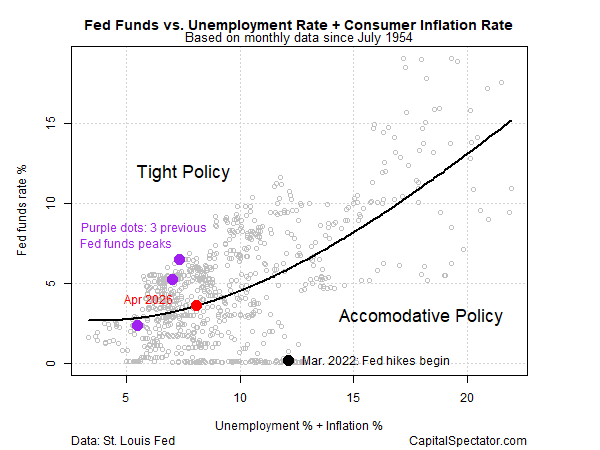
The Capital Spectator’s rough estimate of current Fed policy suggests a neutral stance, based on a simple model that compares the target rate to unemployment and inflation—the two components of the central bank’s dual mandate. A month ago, the estimate indicated that policy was slightly tight. The key takeaway: ongoing inflation risk appears set to shift policy into a dovish stance, assuming the Fed continues to leave rates unchanged.

Fed funds futures are still pricing in high odds of no change for the next several policy meetings. The highest confidence for standing pat applies to the upcoming June 17 FOMC meeting—futures are estimating a 99% probability of keeping rates steady. A 90‑plus percent probability of no change is currently assigned to the July meeting.

The tension between the 2‑year yield and expectations for Fed funds will be closely monitored in the days and weeks ahead. A capitulation on one side or the other would be notable, although analysts seem to be leaning toward the view that expectations for a Fed rate hike are building.

“I do think there is a real fear that inflation is kind of embedded in the economy going forward,” said Peter Tuz, president of Chase Investment Counsel in Charlottesville, Virginia.

“A new inflation regime awaits [Kevin] Warsh,” the new Fed chief, writes Joseph Brusuelas, chief economist at RSM US.

“The fact that we are now seeing data backing up inflationary fears that have been in the market since the Middle East conflict started is key,” said Nick Twidale, chief markets analyst at ATFX Global.

A repricing of Fed funds futures to reflect the shift in sentiment may prove to be the decisive factor prompting a capitulation by the doves.


Book Bits: 16 May 2026

The Capital Spectator -

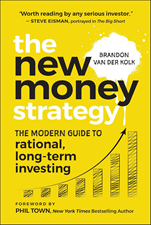
The New Money Strategy: The Modern Guide to Rational, Long-Term Investing
Brandon van der Kolk
Summary via publisher (Wiley)
The New Money Strategy: The Modern Guide to Rational, Long-Term Investing is the ultimate strategy guide to help a new generation of investors harness the power of value investing and the stock market. In this book, Brandon van der Kolk, founder of the popular New Money YouTube channel with more than one million dedicated subscribers, reveals the common mistakes people are making in the markets today and the time-tested strategy to build long term wealth.

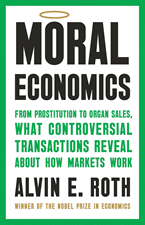
Moral Economics: From Prostitution to Organ Sales, What Controversial Transactions Reveal About How Markets Work
Alvin E. Roth
Interview with author via Critical Mass podcast
Alvin Roth is a Nobel Prizewinning Economist whose work on designing markets has had real world impacts that may have saved thousands of lives around the world, while arousing strong emotions both for and against the programs he has helped put in place. Clearly not one to shy away from controversy, he represents the best of what The Origins Project is trying to promote: applying science and reason to public policy. In short, connecting science and culture! Roth’s new book, which is fantastic, and comes out the same day this podcast is released deals with issues that often raise the public’s ire, from legalizing prostitution, to assisted suicide, and finally to a rational market for kidney transplants.

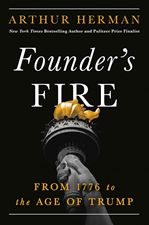
Founder’s Fire: From 1776 to the Age of Trump
Arthur Herman
Review via The Wall Street Journal
This year is dedicated to the 250th anniversary of the birth of the United States. Most historians are concentrating on the birth itself, when 13 disparate colonies along the east coast of North America declared their intention to separate from Great Britain. That, to be sure, is quite a story, one without previous precedent. So is the story of the Constitutional Convention a few years later, which produced what is now the world’s oldest constitution of a complex sovereign state, amended only 27 times.
In “Founder’s Fire” Arthur Herman—whose books of popular history include “How the Scots Invented the Modern World” (2001)—gives these stories their due. But Mr. Herman sees a bigger picture here. He argues, in this entertaining and enlightening book, that the spirit—the fire—that drove the Founding Fathers to risk everything to establish something very new has animated this country ever since.

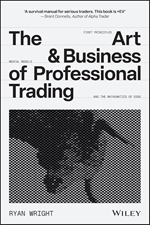
The Art and Business of Professional Trading
Ryan Wright
Summary via publisher (Wiley)
The library of trading literature falls into three largely useless categories. Pop-psychology books focus on mindset and discipline, but psychology is downstream of process. If you lack edge, no amount of mental work saves you. Paint-by-numbers manuals promise certainty through precise setups and mechanical rules, but in an adversarial, reflexive market, widely-known patterns become traps, and the playbook becomes a liability. Academic tomes provide mathematical rigor disconnected from the reality of execution under uncertainty. The Art and Business of Professional Trading occupies the void between them. It is what has been missing for the ambitious trader ready to move beyond hobbyist speculation and think with the rigor of an institutional desk.

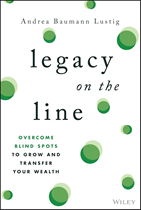
Legacy on the Line: Overcome Blind Spots to Grow and Transfer Your Wealth
Andrea Baumann Lustig
Summary via publisher (Wiley)
In Legacy on the Line: Overcome Blind Spots to Grow and Transfer Your Wealth, sixth-generation wealth adviser and Managing Partner of Fischer Stralem Advisors, Andrea Baumann Lustig shares 30 years of insights working with families to help build and transfer wealth. With the largest wealth transfer in history—$124 trillion—underway, many families risk losing their legacy not through lack of resources, but through unexamined beliefs that quietly undermine their financial future. This book reveals 10 common blind spots that sabotage legacy planning—convictions so deeply held they go unchallenged, often leading to missed opportunities, increased risk, and unnecessary costs.

Please note that the links to books above are affiliate links with Amazon.com and James Picerno (a.k.a. The Capital Spectator) earns money if you buy one of the titles listed. Also note that you will not pay extra for a book even though it generates revenue for The Capital Spectator. By purchasing books through this site, you provide support for The Capital Spectator’s free content. Thank you!

Factor Extremes: Momentum Runs Hot as Low-Vol Stumbles

The Capital Spectator -

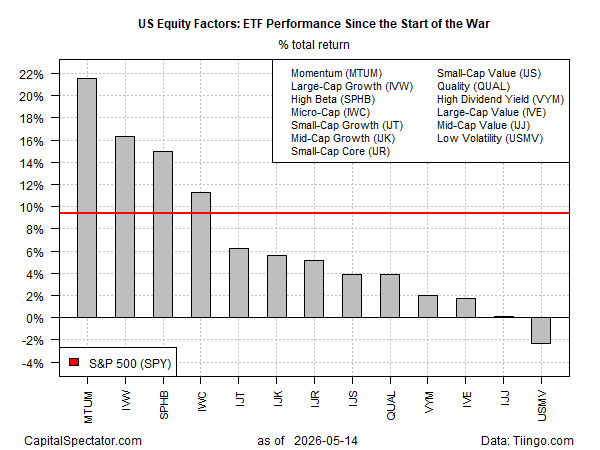
The US stock market surged to yet another record high on Thursday, a new milestone that suggests a rising tide is lifting all equity sectors. Yet reviewing the market through a risk-factor risk lens tells a more nuanced story, revealing a wide dispersion of trends that have emerged since the conflict with Iran began on Feb. 28, based on a set of ETFs through yesterday’s close (May 14).

The results suggest that much of the difference between equity-portfolio strategies during the war-regime period can be traced to factor allocations. For example, among the winning strategies of late there’s a good chance that the portfolios have relatively high allocations to the momentum factor, intentionally or otherwise.

The momentum factor is the clear leader, outperforming the rest of the field by a wide margin. The iShares MSCI USA Momentum Factor ETF (MTUM) has surged 21.6% since the attack started nearly three months ago. The next-strongest performer is large-cap growth (IWV) with a 16.3% rally. Both funds are posting sharply higher gains vs. the market benchmark via SPDR S&P 500 ETF (SPY), which is up 9.4% since Feb. 28.

Most equity factors are trailing the broad market (SPY), including one downside outlier. The low-volatility factor has delivered especially poor results since the start of the conflict, which has shifted to a precarious stalemate that continues to block energy exports from the Gulf. The iShares MSCI Minimum Volatility ETF (USMV) has lost 2.3% since Feb. 28.

Despite the headline strength in equities, the widening gap between factor winners and laggards underscores how uneven the market’s internal dynamics have become. Momentum’s dominance and low volatility’s slump suggest investors are rewarding exposure to persistent trends while shunning defensive positioning, even as geopolitical risk remains elevated. That divergence is a reminder that record highs can mask shifting fault lines beneath the surface—fault lines that may matter far more if the current geopolitical stalemate breaks in either direction.

Learn To Use R For Portfolio Analysis
Quantitative Investment Portfolio Analytics In R:
An Introduction To R For Modeling Portfolio Risk and Return

By James Picerno

Treasury Premium Climbs Again, Fueled by Sticky Inflation

The Capital Spectator -

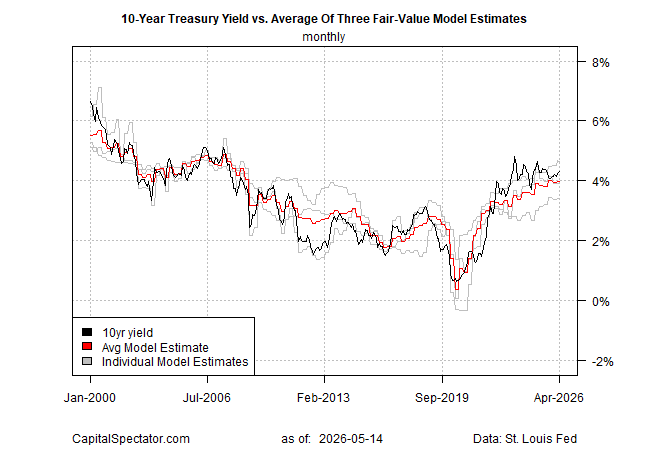
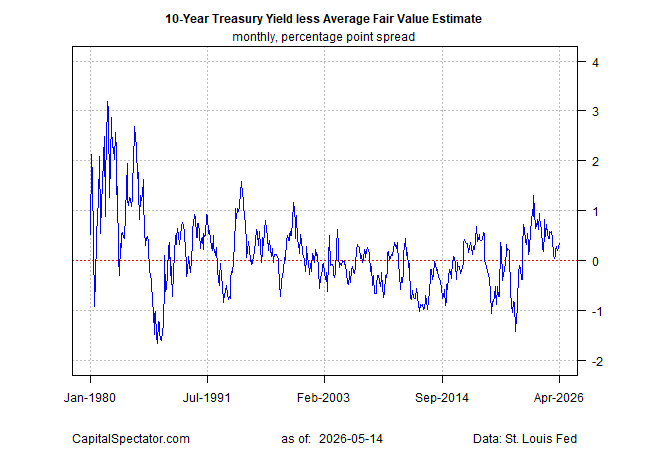
The market premium for the US 10-year Treasury yield over a fair‑value estimate remained modest in April but has been edging higher after falling to a near‑equilibrium level late last year. The threat of higher inflation stemming from the Iran conflict remains a risk factor, though the repricing of the market premium has been modest so far.

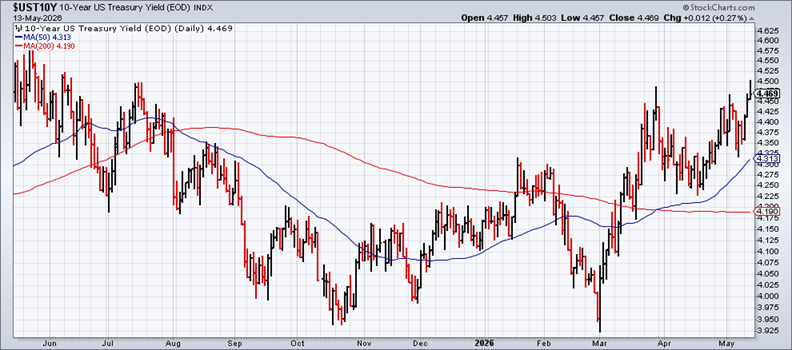
The gradual shift may begin to accelerate in the months ahead as inflation risk moves to center stage in the bond market. The 10‑year yield rose to 4.47% yesterday (May 13), the highest close since last August. The recent upside bias suggests that the pickup in inflation triggered by the Middle East turmoil is starting to alter sentiment for fixed‑income securities.

The Labor Department reported this week that consumer and wholesale inflation continued to post sharp increases in April.

“Inflation is sticky and accelerating. The core reading confirms a deeper structural trend, especially in services,” said David Russell, global head of market strategy at TradeStation. “The Hormuz crisis is aggravating the problem, but this goes way beyond oil.”

The market premium relative to The Capital Spectator’s fair‑value estimate of the 10‑year yield ticked up to 35 basis points last month. That remains modest by historical standards, but if inflation stays elevated—or shows signs of rising further—the premium will likely increase in the months ahead.

What we’ve seen is investors pricing in higher long‑term inflation into what they want to receive from lending to the government,” said Luke Tilley, chief economist at Wilmington Trust.

By late 2025, the surge in the 10‑year premium associated with the 2021–2022 inflation spike had faded to nearly zero. But the calculus is changing as the conflict with Iran continues and threatens to become a protracted affair that keeps Gulf energy exports blocked and inflation elevated.

A quick resolution that allows exports to resume would likely keep the yield premium modest. But with diplomatic efforts at a standstill and US threats to resume military operations if Iran doesn’t compromise, the timeline for an end to the conflict remains unclear. As a result, the yield premium—and interest rates more broadly—appear poised to rise in the near term.

Is Recession Risk Rising? Monitor the outlook with a subscription to:
The US Business Cycle Risk Report

US–Iran Crisis Edges Toward Prolonged Stalemate

The Capital Spectator -

President Trump is warning that the US could restart strikes on Iran, a stance that reads less like a negotiating tactic and more like the opening move in a drawn‑out standoff. A few days ago, he described the fragile cease-fire as being on “massive life support.” In other words, a long, grinding stalemate appears to be taking shape. That’s a threat to the global economy because as the impasse drags on and energy exports from the Gulf remain blocked, the world’s oil supply shrinks and scarcity risks rise.

“From the point of view of energy, this is a snowball — and every week that passes, you have tighter markets,” says Jaime Brito, executive director of refining and oil products at Dow Jones Energy.

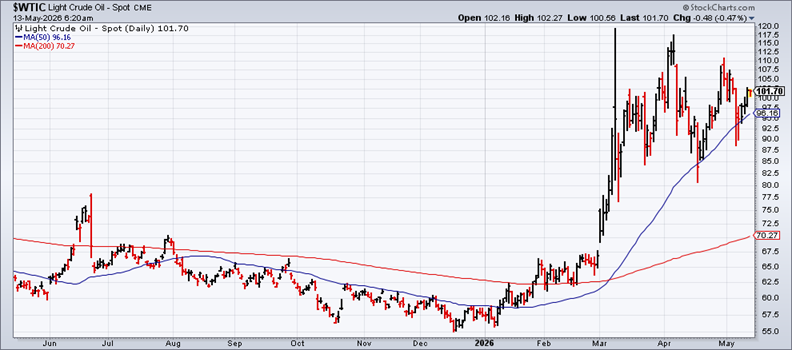
Oil prices reflect that uncertainty. The US benchmark, West Texas Intermediate, traded near $107 a barrel yesterday — a middling range following the surge since the war began.

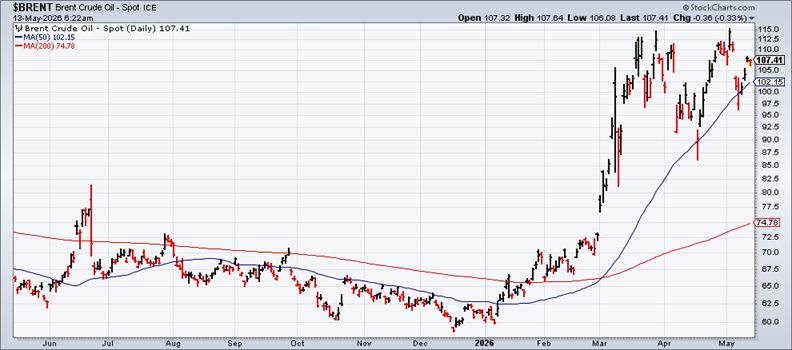
Brent crude, the global benchmark, is trading closer to its upper range, reflecting the higher level of vulnerability for Europe and Asia related to oil imports relative to America’s domestic oil supplies. A break higher from the current $107 level for Brent would signal that the market is starting to price in a higher risk that the conflict’s stalemate will have deeper and longer‑lasting effects on the global economy, including inflation.

Recent developments behind the scenes aren’t encouraging. A troubling report suggests Iran has tightened its control over the Strait of Hormuz after establishing a new Persian Gulf Strait Authority and positioning itself as the sole gatekeeper for this strategic energy corridor.

According to Lloyd’s List Intelligence, the agency is now demanding that vessels submit application forms for passage — an effort to control transit approvals and collect tolls. Iran’s Islamic Revolutionary Guard Corps (IRGC) “has imposed a de facto ‘toll booth’ regime in the Strait of Hormuz, requiring vessels to submit full documentation, obtain clearance codes and accept IRGC‑escorted passage through a single controlled corridor.”

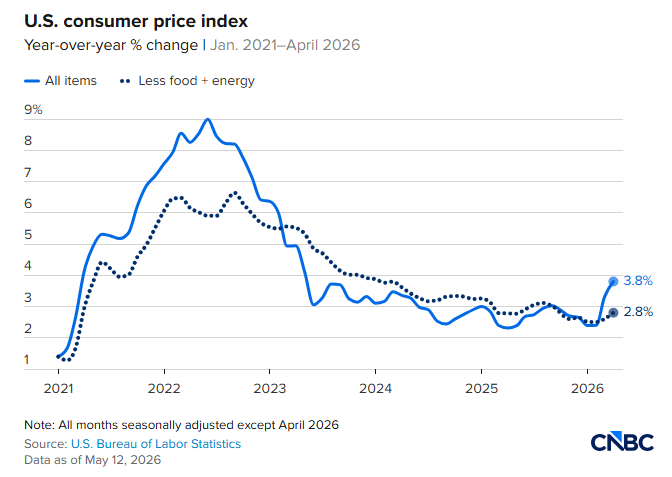
The immediate economic threat is inflation, which continues to rise. Headline consumer inflation increased 3.8% in April from a year earlier — a three‑year high, the Bureau of Labor Statistics reported on Tuesday. The main driver: higher energy costs.

“Inflation is the key drag on the U.S. economy now,” said Heather Long, chief economist at Navy Federal Credit Union. “This is hurting Americans. There is a real financial squeeze underway. For the first time in three years, inflation is eating up all wage gains. This is a setback for middle‑class and lower‑income households, and they know it.”

Inflation will ease once the Middle East crisis is resolved. Unfortunately, the path out of the stalemate isn’t clear, and the US — and the West — increasingly looks boxed in. A resumption of military strikes might break the gridlock, but Iran’s regime has already shown it can take a beating and still maintain its stranglehold over Gulf exports.

Meanwhile, President Trump’s summit with China’s President Xi Jinping may yield a breakthrough, according to some analysts. But before departing Washington for Beijing, Trump downplayed the potential for engaging China to persuade Iran to open the Strait.

“I don’t think we need any help with Iran,” Trump said. “We’ll win it one way or the other, peacefully or otherwise.”

Exactly what that means — and on what timeline — is unclear. In the meantime, the clock is ticking, and the risk of a deeper, longer energy shock continues to rise.


Higher Inflation is Becoming Baked Into Expectations

The Capital Spectator -

President Trump said the ceasefire with Iran is on “massive life support,” which suggests that inflation risk will remain elevated.

Oil prices continue to trade above $100 a barrel for the US crude benchmark as Trump has become increasingly frustrated with Iran’s negotiating positions to formally end the conflict that is keeping Gulf energy exports blocked. This disruption is keeping prices high and driving up headline measures of inflation. With no clear exit strategy on the horizon, markets are pricing in higher odds of persistent inflation.

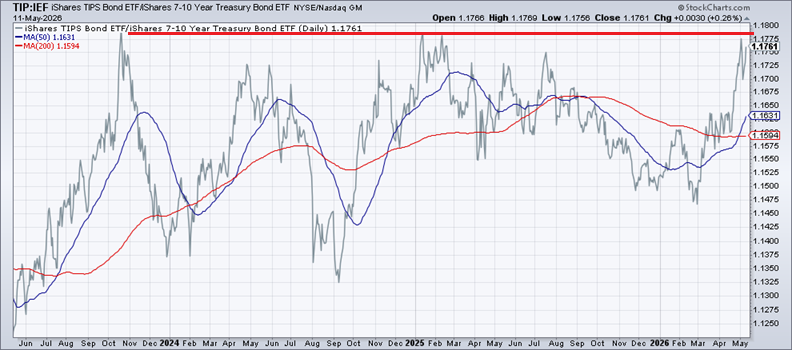
One metric to watch is the ratio of the iShares TIPS Bond ETF (TIP), a portfolio of inflation‑indexed Treasuries, to a similar fund that holds conventional government bonds (IEF). As this ratio rises, it implies that the market is demanding a higher inflation premium. Notably, the ratio is trading near the peaks of recent years. A decisive break above this level (red line in the chart below) would signal stronger concern that inflation risk could run longer and higher than recently expected.

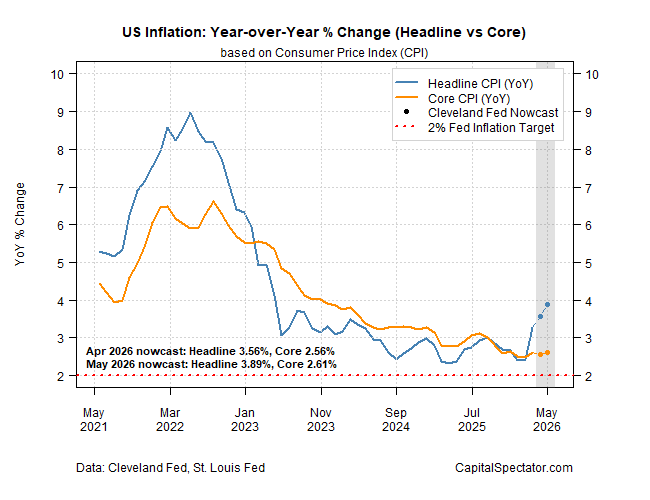
Today’s April report on consumer prices is expected to highlight another month of hotter inflation. The Cleveland Fed’s current inflation nowcast indicates that the rise in headline CPI will continue through May.

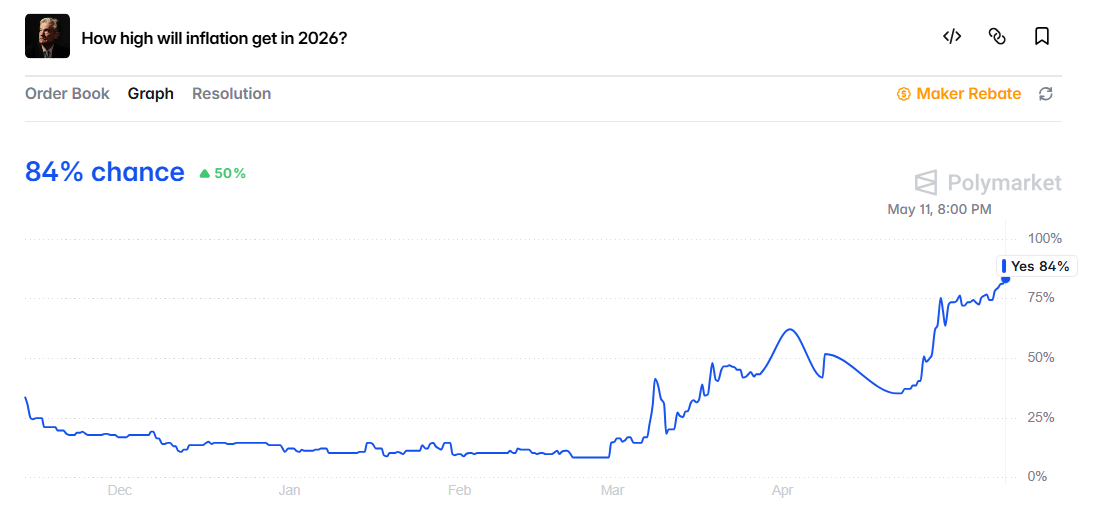
Betting markets are pricing in higher odds that inflation will top 4% this year, substantially higher than the 3.3% year‑over‑year trend reported for headline CPI through March.

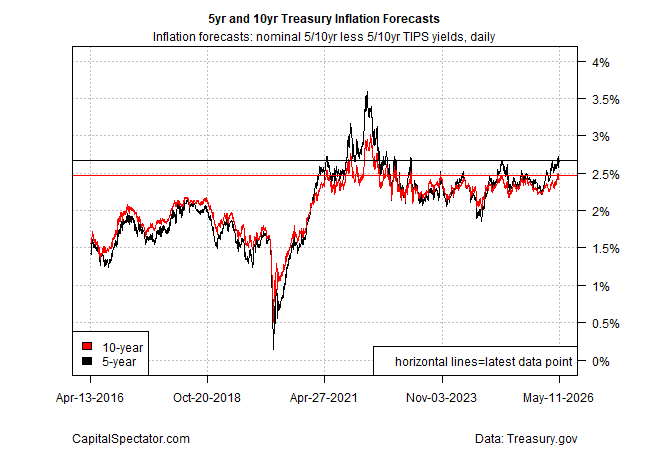
The Treasury market’s implied inflation forecast is also near multi‑year highs, based on the spread between inflation‑indexed yields and their nominal counterparts. The 5‑year forecast is 2.67% as of May 11, just below last week’s 2.72% peak. A sustained push above that peak would highlight the market’s growing confidence that inflation risk will persist.

Perhaps the final straw in the repricing of inflation risk will be rising expectations that the Federal Reserve will increase interest rates to combat the shift. For now, that remains a low‑probability scenario based on Fed funds futures, which continue to price in high odds that the central bank will leave its target rate unchanged for the next several policy meetings.

That view may persist if core readings of inflation remain relatively stable, as they have recently. These measures of pricing pressure tend to hold more sway at the Fed. But the longer the Middle East conflict continues and energy exports remain blocked, the higher the odds that the status quo for Fed expectations will give way to a hawkish pivot. A sign that this shift is gaining momentum: core inflation continues to edge higher.


Pages