The Capital Spectator

Stock Market At Record High as Iran Crisis Deepens

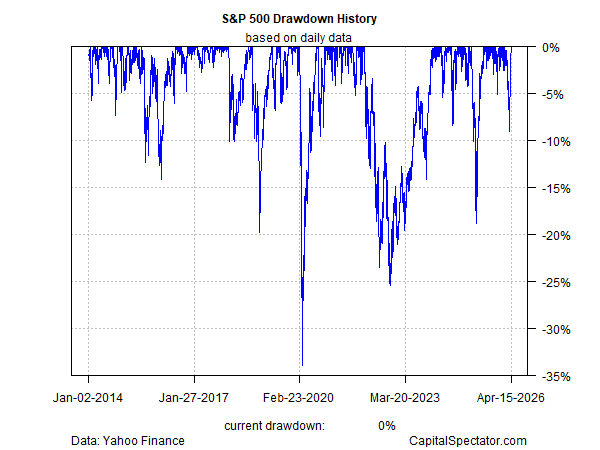
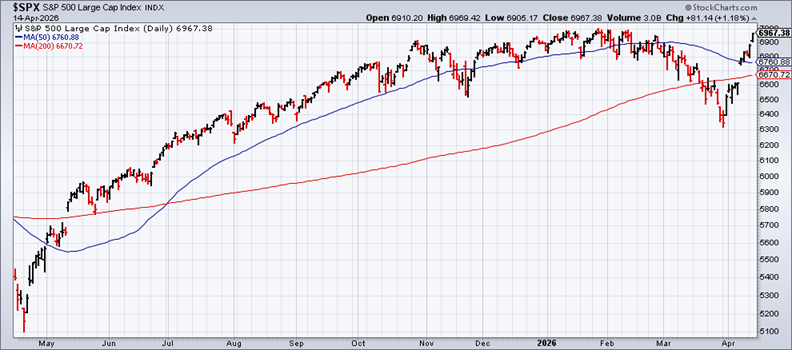
The US stock market closed at a record high on Friday (Apr. 17), but a few days ago is ancient history when the firehose of war news can reshape investor sentiment by the hour. Right on cue, the trading week ahead has plenty of fresh shape-shifting headlines to process and decide if last week’s optimism revival still resonates.

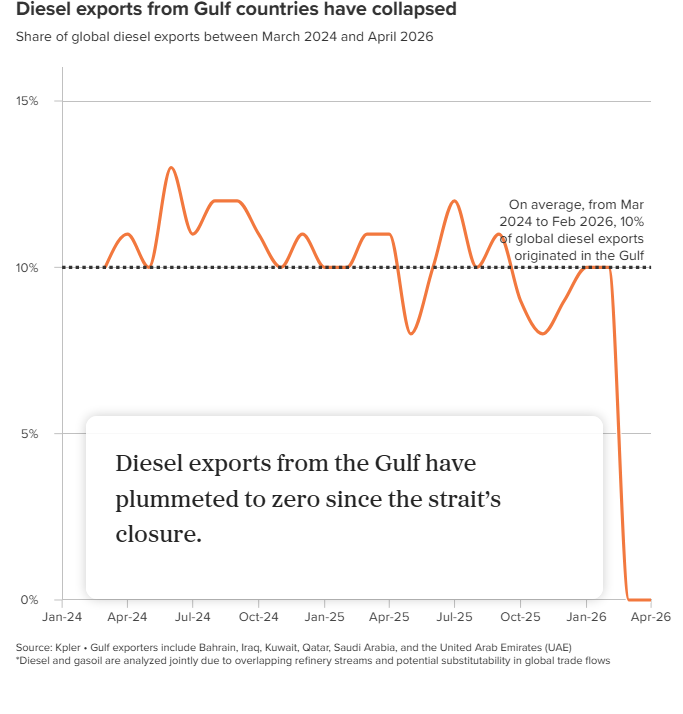
Among the highlights over the weekend: Iran reversed its earlier agreement to reopen the Strait of Hormuz to restart energy exports, with hardliners in the country asserting control and insisting it will remain shut as long as the US blockade continues. A US Navy ship fired on an Iranian cargo ship violating America’s blockade, later seizing the vessel. Iran vowed to retaliate. Meanwhile, Vice-President Vance is headed to Pakistan again for peace talks, but Tehran says it has no plans for further talks with the US.

What this means for markets is anyone’s guess, but equities begin the week from a position of strength. The S&P 500 Index’s recovery set a record for speed, but the drama may not be over just yet. The key challenge is that while stocks priced in an effective end to the war, it’s still not obvious that a quick solution the supply-energy shock is imminent.

“We had the most violent day in the strait on Saturday that we’ve had since the beginning of this crisis, and things don’t seem to be getting any better,” Rory Johnston, founder of Commodity Context, tells CNBC. “While we keep getting these sell-offs and it keeps seeming like we’re about to finally get that football — Lucy pulls it away — and we’re back to where we started. The strait still isn’t flowing, and 13 million barrels a day of production remains shut-in. We’re losing it every single day this goes on.”

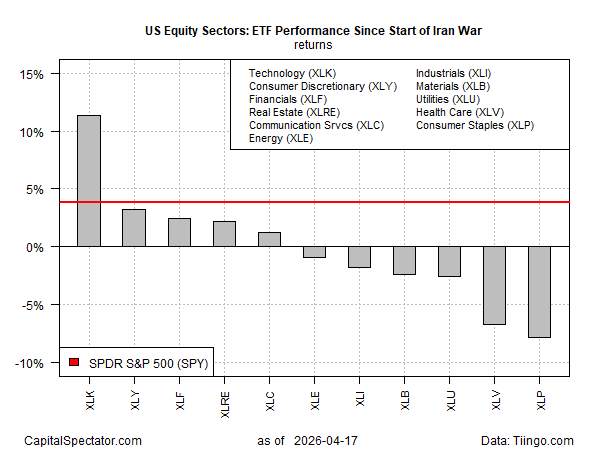
As for the resiliency in the stock market through Friday’s close, much of the hefty lifting comes from technology stocks. Using a set of ETFs to track the sectors that comprise the S&P 500 highlights that tech (XLK) is the leading source of gains by far when measured since the war’s start through the end of last week. XLK is up more than 11% during the conflict, far above the S&P 500’s 3.8% rise since Feb. 28. The rest of the sectors are split with a mix of gains and losses.

Upbeat earnings news is a key factor for the stock market’s overall resiliency. FactSet reports: “For Q1 2026 (with 10% of S&P 500 companies reporting actual results), 88% of S&P 500 companies have reported a positive EPS surprise and 84% of S&P 500 companies have reported a positive revenue surprise.”  

In terms of performance, however, tech is still doing the hefty lifting, largely thanks to optimism, overbaked or not, related to the business opportunities in artificial intelligence (AI).

Therein lies a familiar question for investors that’s taken on greater relevance: Can bullish sentiment fueled by AI keep the party going in what could be a protracted battle over reopening the strait?

One reason that the bulls are still answering “yes” relates to expectations of the disinflationary effect of AI for the economy. Citing that “many companies are talking about efficiency gains from AI,” the head of Northern Trust’s $1.4 trillion asset management unit predicts: “If even a portion of those [gains] actually materialize on an economy-wide basis, it could be one of the biggest positive supply shocks we’ve ever seen,” Mike Hunstad tells the FT. “You can’t ignore that.”

By that reasoning, the “massively disinflationary” outlook he thinks is possible leaves room for the Fed to stand pat on monetary policy until it’s clear how AI-driven productivity gains evolve.

“AI has the potential to be massively disinflationary,” Hunstad advises.

Perhaps, but whether that’s enough to keep stocks rallying in the short term is another question entirely.

Is Recession Risk Rising? Monitor the outlook with a subscription to:
The US Business Cycle Risk Report

Book Bits: 18 April 2026

Mobilize: How to Reboot the American Industrial Base and Stop World War III
Shyam Sankar and Madeline Hart
Review via The Wall Street Journal
Shyam Sankar is a Silicon Valley Paul Revere. The chief technology officer of the software company Palantir, Mr. Sankar comes at us with warnings of imminent danger, although not on a galloping steed. Instead, he delivers his hair-raising message—that we’re staring at “a humiliating and bloody defeat” if we go to war with China—in a jaunty, clever and sometimes breathless book.
“Mobilize,” written with the assistance of Madeline Hart, a strategist at Palantir, intends to jolt us out of our national-security slumber. “Complacency in peacetime can lead to war,” Mr. Sankar writes. (The book went to print before the U.S.-Israeli use of force against Iran.)

Lucky Devils: The True Story of Three Rebel Gamblers Who Beat the Odds and Changed the Game
Kit Chellel
Review via Publishers Weekly
Bloomberg journalist Chellel (Dead in the Water) sheds light on advantage gambling, or using math and technology to beat the house, through the stories of three of its pioneers in this fascinating history. In the 1970s, gamblers Bill Nelson, Rob Reitzen, and Bill Benter arrived in Las Vegas obsessed with beating the house, and went on to redefine what that meant. Nelson’s success with a computer-driven sports betting syndicate drew FBI scrutiny before he resurfaced with a lucrative roulette operation. Reitzen went from playing poker in casinos to founding online poker sites where human players competed against algorithmic bots, with fortunes won and lost at dizzying speed. The most spectacular arc belongs to Benter, who became a legend in Hong Kong and U.S. horse racing by combining massive betting syndicates with sophisticated statistical modeling, and later parlayed his winnings into the Benter Foundation, which supports causes including the arts, Alzheimer’s research, and financial education.

Financial Mathematics for Cryptocurrencies
Tom J. Espel
Summary via publisher (Wiley)
Financial Mathematics for Cryptocurrencies by Tom J. Espel combines two of today’s most dynamic fields – quantitative finance and cryptocurrencies – in a comprehensive guide that addresses the unique mathematical challenges faced by everyone involved in the crypto markets. Espel draws on his extensive experience in frontier assets to explain the analytical frameworks you’ll need to make informed investment decisions, identify pricing opportunities, and manage risk in this volatile asset class. The book adapts relevant quantitative finance methodologies specifically for digital assets, bridging the gap between traditional financial mathematics and the distinctive characteristics of blockchain-based instruments. Espel introduces three essential constructs for DeFi pricing theory: network time, the validator account as a new numéraire, and wrapped token frameworks for cross-chain valuation. Its modular structure allows readers to navigate directly to relevant sections, covering everything from blockchain fundamentals to advanced valuation models, staking contract mathematics, and liquidity cost analysis in cryptocurrency markets.

Please note that the links to books above are affiliate links with Amazon.com and James Picerno (a.k.a. The Capital Spectator) earns money if you buy one of the titles listed. Also note that you will not pay extra for a book even though it generates revenue for The Capital Spectator. By purchasing books through this site, you provide support for The Capital Spectator’s free content. Thank you!

Crisis in Transit: War’s Economic Fallout Is Only Beginning

Markets are pricing in higher odds that the war with Iran has ended, but even if that proves true, the economic effects of the conflict will linger for months, if not years.

Most of the world’s attention is focused on the immediate drama of conflict—military attacks, closures, and sanctions. But the most destabilizing effects of war in the Persian Gulf don’t unfold in real time. They arrive with a delay, reverberating slowly across oceans in the hulls of tankers and reflected in reduced exports of natural gas and crucial agricultural feedstocks. That lag in transit time suggests the global economy has only begun to feel the consequences of reduced exports from the region.

“Wars have a way of revealing the world’s hidden architecture,” writes Comfort Ero, president and CEO of the International Crisis Group. “We notice the narrow straits, the fragile chokepoints, the invisible bargains that keep daily life intact only when they begin to fail. Today, the Strait of Hormuz is one such place.”

Oil exported from the Persian Gulf typically takes 30–45 days to reach major markets in Europe, Asia, and the Americas. When conflict disrupts production or shipping lanes, the impact isn’t instantaneous. Instead, the world consumes existing inventories while the flow of new supply slowly declines. By the time the shortage becomes visible in destination markets, the underlying problem has already been compounding for weeks.

The sharp reduction in oil production and exports last month is the first sign that the disruption in global supply is beginning to reverberate. OPEC’s production fell by 27% in March — a record drop — and prospects for a quick rebound look dim, even if the current ceasefire holds. In the best‑case scenario, it will take months for Gulf states to restore production to normal levels, predicts Sheikh Nawaf al‑Sabah, CEO of Kuwait Petroleum Corp.

Meanwhile, the lag in energy exports fosters a misleading illusion of stability as attention shifts to the decline in military attacks. But the war’s effects will resonate far into the future.

Luke Gromen, president of Forest for the Trees, a research shop, recently noted that seven weeks into the conflict the Strait of Hormuz is still closed. “Supply chain issues are just now really starting to to stack up.” As an example, he cites Toto, a Japanese toilet maker, has halted new orders for its prefabricated bathrooms due to material shortages as the Iran war continues to strain the global oil supply chain.

Consider the US farming industry. The planting season ends in about six weeks, and surging fertilizer prices driven by the conflict are forcing farmers into a corner: reduce planting or proceed as planned and absorb a financial hit. A survey by the American Farm Bureau Federation reports that “nearly six in 10 farmers report worsening finances, reflecting rising fertilizer and fuel costs during spring planting.”

Although only a small fraction of pre‑war commercial traffic has moved through the strait in recent days—an improvement from the near‑shutdown in previous weeks—it remains unclear how quickly exports will recover.

“Even if the strait were to reopen soon, the underlying supply and logistical stresses of the waterway’s closure will likely persist for months,” notes the Atlantic Council. “Much of the region’s refining capacity has been damaged or destroyed during the conflict, and the infrastructure required to process and export commodities may take years to fully rebuild.”

Oil is hardly the only export at risk. The Persian Gulf is a major source of natural gas liquids, ammonia, urea, and other petrochemical feedstocks essential for global fertilizer production. A sustained disruption in these flows threatens agricultural supply chains far beyond the region.

A delay of even a few weeks in feedstock shipments can cascade into reduced fertilizer availability, lower crop yields, and higher food prices months later.

The war’s impact on oil and fertilizer feedstocks is a slow‑moving shockwave. The world is still in the early phase, buffered by inventories and pre‑conflict shipments. But as the lag catches up, reduced exports from the Persian Gulf will exert growing pressure on energy prices, food production, and global economic stability.

The real effects aren’t behind us. They’re just beginning to arrive.

Is Recession Risk Rising? Monitor the outlook with a subscription to:
The US Business Cycle Risk Report

Whiplash Rally: Stocks Hit New High Just Days After Sharp Drop

In another display of resilience, the stock market rebounded to a record high on Thursday following the recent correction. The drawdown wasn’t particularly unusual, or unexpected, given the geopolitical risk lurking in the background. But the recovery from the low was notable for its speed.

The latest cycle of peaking and recovery cut the S&P 500 Index by 9.1% at the deepest drawdown (Mar. 30), ranking as the 32nd‑deepest peak‑to‑trough loss since 1955. It was a relatively significant loss, but far from the deepest on record—roughly the ninth percentile in the context of the skewed historical data for S&P drawdowns for the past seven decades.

The speed of the rebound off the trough—just 11 trading days—set a new record for drawdowns of 9% declines or deeper. The previous fastest recovery occurred in early 2000, when the market fully erased its drawdown in 17 days.

In a world of whirlwind news cycles and rapidly evolving macro guesswork in recent years, market sentiment is moving faster. For investors looking at their latest statements, that’s a good thing for now, at least through yesterday’s close. But volatility continues to work both ways, and I suspect the rollercoaster ride will persist at a degree that’s more extreme than the historical record.

One implication: the behavioral skill set of looking through short‑term noise is more valuable than ever.

Then again, am I seeing ghosts? Although current events have been taking markets on a wild ride lately, it’s still reasonable to argue that the jury’s still out on whether volatility has undergone a regime shift. Using Morningstar’s calculations, it’s not yet obvious that the big picture has changed.

“Expressed in standard deviation of daily returns, or how much the index’s fluctuations vary from their average, volatility for 2026 through April 10 registered at 15% on an annualized basis,” writes Dan Lefkovitz, a strategist at Morningstar. “It turns out that 15% is right about average for US stock market volatility,” he observes, based on the average annual standard deviation of daily US stock market returns for the past century.

Plus ça change, plus c’est la même chose.

Learn To Use R For Portfolio Analysis
Quantitative Investment Portfolio Analytics In R:
An Introduction To R For Modeling Portfolio Risk and Return

By James Picerno

Against the Odds: US Is Relatively Resilient Despite Global Turmoil

How much policy uncertainty and geopolitical risk can the US economy absorb without derailing its expansion? More than many analysts expected.

As a thought experiment, let’s return to Jan. 1, 2025. Your task is to consider what the economic impact would be if the global trading system were upended with tariffs and a major war in the Middle East sharply raised energy costs. Would those events disrupt the US economy, perhaps to the point of triggering recession? Answering “yes” would have been a reasonable forecast. But here we are, and economic activity—although battered and bruised by some measures—is still skewed toward growth overall.

How long this lasts is unclear, but a review of several indicators suggests that US economic resilience has been more durable than many of us would have expected when gaming out a world of tariffs and war with Iran.

Part of the reason is US energy independence. As a net energy exporter, the economy’s reliance on oil imports is low. That doesn’t shield the country from surging energy costs — oil is priced globally, not locally. But compared with the high dependence on imported oil in Asia, for instance, the US is in far better shape to weather a supply-side energy shock.

There are limits to US resilience, of course, and those limits may be near. Much depends on how long oil prices (and energy costs generally) remain elevated. As I discussed yesterday at TMC Research, the risks of higher inflation and slower growth will rise the larger the potential shock to the economy in the months ahead.

“After withstanding higher trade barriers and elevated uncertainty last year, global activity now faces a major test from the outbreak of war in the Middle East,” the IMF warned yesterday. “A longer or broader conflict, worsening geopolitical fragmentation, a reassessment of expectations surrounding artificial intelligence–driven productivity, or renewed trade tensions could significantly weaken growth and destabilize financial markets.”

The US stock market, however, appears to be pricing in higher odds that the worst has passed. The S&P 500 Index yesterday (Apr. 14) rallied for a second day, recovering nearly all of the loss since peaking earlier in the year.

The stock market isn’t the economy, as the caveat goes, but several proxies for the business cycle suggest a growth bias is holding. For example, the Dallas Fed’s Weekly Economic Index (WEI) reflects real year-over-year economic growth of 2.7% through Apr. 4. That’s up from a 2.0% pace through last year’s fourth quarter, based on GDP data.

Several other real-time measures of economic activity also point to ongoing resilience. The Johnson Redbook Index—a weekly year-over-year measure of same-store sales growth for large US general merchandise retailers (roughly 80% of retail sales)—rose 7% for the week through Apr. 11, in line with the trend in recent months. The implication: consumer spending has yet to take a hit from the war.

None of this is to suggest that there are no warning flags. Au contraire. The sharp rise in headline consumer inflation in March suggests that the war’s effects on the economy and spending may not be trivial. Add to that the possibility that economic growth could be sluggish in the upcoming Q1 GDP report, according to the Atlanta Fed.

One measure of consumer sentiment is also flashing red. “Consumer sentiment sank about 11% [in April], extending a decline that began with the start of the Iran conflict, and is currently about 9% below a year ago,” according to the University of Michigan’s widely followed survey.

In the hard data, by comparison, the signs of trouble for the US economy are still limited. It would be naïve to expect no repercussions. But the blowback so far has been minimal, at least from a top-down perspective. But economic data arrives with a lag and so the brunt of the war’s effects will likely become clearer in the weeks and months ahead.

Watching the incoming data, in short, is a high priority. Meanwhile, the US economy appears to be beating the odds by staying resilient. The relative strength has surprised more than a few keen observers of the economic scene.

“It is notable that client sentiment, especially in the US, seems quite resilient considering the amount of uncertainty you have in the Middle East,” says Jeremy Barnum, JPMorgan’s chief financial officer.

A fragile peace in the war with Iran continues, which lays the groundwork for cautious optimism. A resumption of hostilities, by contrast, would likely be cause for downgrading resiliency expectations. By that standard, evaluating macro risk remains a day-to-day affair.


In 2026’s Wartime Markets, Risky Debt Outshines Treasuries

Bonds are prized for offering stability in an asset‑allocation strategy, providing an offset to the higher risk in stocks, particularly during periods of market stress. But since the Iran war began, fixed‑income securities have had a rough ride as markets struggle to assess whether the conflict’s main threat is higher inflation, slower growth (if not recession), or some mix of both.

A broad review of the US bond market, using a set of ETF proxies, shows that some corners of fixed income are posting gains since the conflict began on Feb. 28. But the winners aren’t the usual suspects that you would expect to shine an energy shock and a Middle East war.

The leading performer so far since the fighting started—through yesterday’s close (Apr. 13)—is bank loans. The Invesco Senior Loan ETF (BKLN) is up more than 2%, far ahead of the rest of the fixed‑income field. Before the war, few investors thinking about safe havens for a new Middle East conflict would have anticipated that BKLN’s portfolio would become a go‑to port in the storm, but here we are.

BKLN primarily holds floating‑rate senior secured loans—also known as leveraged loans—issued by US corporations (see Morningstar profile below). These loans sit high in the capital structure and typically carry below‑investment‑grade credit ratings. The fund’s relatively strong performance suggests that a preference for higher yield, by way of higher risk, has been a motivating factor for investors during the current turmoil.

A conventional junk‑bond ETF is in second place during the war‑driven rally in select slices of the bond market: the SPDR Bloomberg Short Term High Yield Bond ETF (SJNK) is up 0.6%. Just behind it is the iShares 0–5 Year TIPS Bond ETF (STIP), edging up 0.5%.

Meanwhile, medium‑ and longer‑term Treasuries are underwater so far during the war period. The biggest loser is long‑term government bonds (TLT), which have tumbled 3.8%.

One interpretation: inflation worries are dominating risk perceptions for Treasuries. By contrast, the view that government bonds would benefit from heightened anxiety about slower economic activity or recession seems to be in remission at the moment.

But this explanation isn’t fully satisfying. The Treasury market’s implied inflation forecast has remained relatively stable since the war’s start. The so‑called breakeven rate—the yield spread between nominal and inflation‑indexed Treasuries—hasn’t changed much in recent weeks, and is still trading in the mid‑2% range.

If inflation isn’t weighing on Treasuries, what is? Fiscal risk may be a factor. As I’ve been discussing at TMC Research recently, the government’s budget deficit continues to flash warning signs. The high price tag for the war isn’t helping.

Is the bond market looking for new safe havens these days? Hard to know for sure, but the pivot into high‑risk bond securities doesn’t fit neatly into the standard playbook for periods when geopolitical risk spikes.


Iran War May Widen 10-Year Yield’s Market Premium vs. Fair Value

The inflation-driven spike in the market premium for the US 10-year yield in 2022-2023 has been gradually reversing over the last several years. But in the wake of the turmoil in the Middle East, which has raised energy costs and inflation, the pre-war calculus may be set for an attitude adjustment.

The Treasury market’s reaction to the war has been muted so far. The benchmark rate shot up to nearly 4.50% in late-March, but has pulled back to close at 4.34%. A rise above the previous high would signal that the bond market is pricing in higher inflation risk.

The Capital Spectator’s ensemble model currently estimates fair value for the 10-year yield at roughly 4.0%, based on monthly analytics through March. That reflects a mostly steady fair-value calculation in recent months.

A market premium over fair value has prevailed in recent years. During the height of the 2022-2023 inflation shock, the premium spiked to well over a full percentage point. Investor sentiment has been gradually unwinding that premium, but the Middle East turmoil, and the potential for unleashing higher inflation for an unknown period going forward, will likely raise the premium again.

The offsetting factor is the potential for slower growth. The energy-supply shock threatens to elevate inflation and reduce economic growth, which is disinflationary. It’s unclear if one or the other side of this macro equation will dominate.

It’s possible that each risk offsets the other, leaving the yield premium relatively steady and near equilibrium. My guess is that the market will initially favor a higher premium driven by inflation risk, followed by a lesser premium as sentiment pivots to the potential for slower growth later in the year.

The greater clarity on what lies ahead is that the news flow from the Middle East will continue to dictate market sentiment. On that score, the crowd has yet another challenging trading week ahead in the wake of failed peace talks between the US and Iran over the weekend, followed by President Trump’s announcement that the US Navy will ‘interdict’ ships that pay Iran to pass through the Strait of Hormuz. In response, Iran threatened to attack Gulf ports in retaliation against a blockade.

Surprisingly, a fragile ceasefire is holding, as of early Monday. Regional mediators are racing to close remaining gaps between the US and Iran as the ceasefire deadline nears, even as President Trump weighs renewed military pressure if diplomacy stalls.

“The volume of ships passing the Strait needs to surge in the coming two weeks for the oil market to be convinced that the crisis is over,” said Malcolm Melville, a commodities fund manager at Schroders. “If the vessel number surges to 75% of prewar levels, then that represents a near normalization of flows, given the current use of pipelines that were not previously running at full capacity.”

What passes for “normal” these days, however, isn’t showing up on anyone’s bingo card this morning.

Is Recession Risk Rising? Monitor the outlook with a subscription to:
The US Business Cycle Risk Report

Book Bits: 11 April 2026

Planet Money: A Guide to the Economic Forces That Shape Your Life
Alex Mayyasi
Interview with author via WVPB radio
Q: Give me the 30 second version. What is the economy? Why should I care about it?
A: I mean, first I have to give my favorite joke is that economists say economics is what economists do, because there is this way that it’s a little bit nebulous, and that’s what we’re referring to. But I think one answer is that the economy is humanity’s greatest invention. The economy is all of us pursuing our interests and values, training with each other, interacting with each other, working together. Sometimes when we don’t even know it and we just find it absolutely fascinating to try to better understand and learn how it works and share that with other people.

The Coffee Can Investor: A Stock-Picker’s Journey to Build Generational Wealth
Neeraj Khemlani
Summary via publisher (Columbia U. Press)
What would happen if you bought a handful of stocks and then left them alone for some time, like stashing valuables in a coffee can? If you picked the right ones, you might wake up one day with life-changing wealth. Neeraj Khemlani introduces readers to this investing philosophy through the eye-opening story of a portfolio manager who has put it into practice. Matt Ankrum researched 100-baggers—stocks that have multiplied in value a hundred times over multiple decades—looking for what they have in common. Drawing on these clues, he hunts down and buys shares in what he thinks are tomorrow’s breakout companies, planning to gift his children a coffee can portfolio that could someday be worth half a billion dollars.

Financial Mathematics for Cryptocurrencies
Tom J. Espel
Summary via publisher (Wiley)
Financial Mathematics for Cryptocurrencies by Tom J. Espel combines two of today’s most dynamic fields – quantitative finance and cryptocurrencies – in a comprehensive guide that addresses the unique mathematical challenges faced by everyone involved in the crypto markets. Espel draws on his extensive experience in frontier assets to explain the analytical frameworks you’ll need to make informed investment decisions, identify pricing opportunities, and manage risk in this volatile asset class. The book adapts relevant quantitative finance methodologies specifically for digital assets, bridging the gap between traditional financial mathematics and the distinctive characteristics of blockchain-based instruments.

Please note that the links to books above are affiliate links with Amazon.com and James Picerno (a.k.a. The Capital Spectator) earns money if you buy one of the titles listed. Also note that you will not pay extra for a book even though it generates revenue for The Capital Spectator. By purchasing books through this site, you provide support for The Capital Spectator’s free content. Thank you!

Momentum Factor Leads as Wall Street Bets on a Fragile Ceasefire

The tentative ceasefire between the US and Iran is holding as both governments prepare to meet for high‑stakes talks in Pakistan. The foundation for a peace deal may be wobbly, but the stock market is cheering: the S&P 500 Index closed on Thursday (Apr. 9) at its highest level in five weeks. Equity factors have also rallied, though results vary widely, with momentum posting the strongest gain based on a set of ETFs.

The iShares MSCI USA Momentum Factor ETF (MTUM) is leading the field by a wide margin for performance since the war began. The fund is the clear upside outlier, posting a 3.8% gain since the close on Feb. 27, the eve of the conflict’s start. Several other factors have rebounded, but none come close to momentum’s surge.

A number of equity factors remain underwater. The biggest loser since the war began is low volatility (USMV), which has declined 3.6%.

The broad stock market is also posting red ink for the war‑regime period. The SPDR S&P 500 ETF (SPY), despite a sharp rally in recent days, is down 0.6% since Feb. 27.

The revival of risk appetite remains precarious, hinging on the outcome of ceasefire negotiations that begin tomorrow. Markets will be keenly focused on the macroeconomic stakes, which are tied to control, stability, and predictability in the Strait of Hormuz—a chokepoint through which roughly a fifth of global energy supplies flows. At the center of these negotiations is the question of whether energy markets can avoid prolonged disruption—and whether the global economy can withstand the shock if they cannot.

“This is the most effective bargaining chip that Iran has got, and will always have,” said Martin Kelly, the head of advisory at EOS Risk Group, a consulting firm. “This is going to have a huge impact on global trade and the global economy.”

Is Recession Risk Rising? Monitor the outlook with a subscription to:
The US Business Cycle Risk Report

Q1 GDP Poised for Rebound as Fragile Ceasefire Clouds Outlook

US economic activity is still expected to rebound in the upcoming first-quarter GDP report scheduled for Apr. 30, but recovery from Q4’s stall-speed increase may face stronger headwinds in Q2 as the effects from the war with Iran reverberate in the months ahead.

A fragile ceasefire suggests the macro healing can begin, but the conflict’s consequences will take time to assess. Meanwhile, the government’s initial estimate of Q1 GDP is expected to post a 2.3% increase, based on the median nowcast compiled by CapitalSpectator.com from a range of sources. If correct, output in Q1 will recover from a weak 0.7% rise in Q4.

There are several caveats to consider for today’s update. For example, one of the inputs — the Atlanta Fed’s GDPNow model — has downgraded its Q1 nowcast in recent weeks. The current reading estimates growth at 1.3% (as of Apr. 7), down from 2.8% two weeks ago.

A survey-based estimate of GDP has also been revised lower recently. The S&P Global US Composite PMI was cut last week, aligning with a roughly flat performance for US economic activity in March.

“The PMI survey data show the US economy buckling under the strain of rising prices and intensifying uncertainty, as the war in the Middle East exacerbates existing concerns regarding other policy decisions in recent months, notably with respect to tariffs,” says Chris Williamson, chief business economist at S&P Global Market Intelligence. A key source of weakness is the services sector, which “has slipped into contraction for the first time since January 2023,” he reports.

The softer GDPNow and PMI inputs have yet to affect the median estimate, but incoming data between now and the Q1 report due on Apr. 30 are expected to trigger downside revisions.

The odds that a US recession has started or is imminent remain low, based on modeling updated weekly in The US Business Cycle Risk Report. But with the war’s effects still swirling, and uncertainty about the ceasefire, the near-term risks remain elevated.

Mark Zandi, chief economist at Moody’s, writes: recession risks are “uncomfortably high.”

Confidence will rise in the coming weeks for confirming, or rejecting, Zandi’s view. For now, one of the most important risk indicators is evolving in real time: the stability of the ceasefire.

Is Recession Risk Rising? Monitor the outlook with a subscription to:
The US Business Cycle Risk Report

US–Iran Ceasefire Takes Hold, as Fragile Peace Looms

The two-week ceasefire announced by the US and Iran on Tuesday is welcome news, but deciding if the threat of war has truly passed will take time. The peace may be fragile, but markets are already cheering this morning. The true test will unfold over the coming weeks. Here are some of the indicators I’ll be watching for determining if the worst has passed.

Let’s start with the stock market. The S&P 500 Index has already been rallying off its recent low, and the recovery is likely to continue today.

One of the many technical profiles of markets I’ll be monitoring is this variation of my estimate of overbought-oversold conditions for the S&P. As of yesterday’s close, hints of recovery have emerged in recent days.

The performance of Treasury yields will be even more critical this week and beyond. The 10-year yield, for example, has pulled back from its recent runup. The risk appetite’s recovery for the near term will rely in no small degree on the bond market remaining calm. The key variable is whether the expected rebound in war-related headline inflation stays modest and short-lived.

Economic risk will come into sharper focus in the weeks ahead. The Atlanta Fed’s GDPNow model continues to downgrade the expected rebound in output for the first quarter. Yesterday’s nowcast was downgraded to a soft 1.3% for the upcoming Q1 report (due on Apr. 30). That still marks a recovery from Q4’s stall-speed 0.7% gain, but the current Q1 estimate suggests that the war’s effects will remain a headwind for an already struggling economy in Q2.

Inflation will also remain a critical factor for market behavior in the weeks ahead. The concern is that repairing damaged energy infrastructure in the Middle East will take months, perhaps years in some cases, and so relief for headline measures of inflation will arrive slowly.

The initial reaction of US consumers on the inflation outlook since the war started raises a warning flag. Median inflation expectations rose to an expected 3.4% annual pace for the year-ahead outlook, according to the New York Fed’s survey. The question is whether the bump is temporary, or the start of an extended reflationary run for the public’s perception. The Federal Reserve will be closely watching as it determines how or if to adjust its target interest rate in the months ahead.

Speaking of the Fed, keep an eye on how the policy-sensitive 2-year yield evolves from current levels. As I noted yesterday, this key rate has recently shot above the median Fed funds rate, signaling that the market is pricing in a modest rate hike. The futures market disagrees, but sentiment in Treasuries still matters and so the 2-year yield’s path ahead could play a key role in determining the risk appetite for the near term.

The main test will be the durability of the ceasefire. Talks between the US and Iran are scheduled to start on Friday in Islamabad to discuss Iran’s 10-point plan, which President Trump said was a “workable basis” for negotiations in a social media post. Meanwhile, Iran’s foreign minister Abbas Araghchi announced that Tehran would allow two weeks of “safe passage” of energy shipments through the Strait of Hormuz.

It’s unclear how much give and take each side will tolerate in the upcoming talks. For now, a precarious peace prevails.

“Markets will be able to breathe for at least a few days,” said Michael Alfaro, chief investment officer at Gallo Partners, a US hedge fund.

There’s still no quick fix for the energy shock, even if the war is truly over.

“Presuming traffic begins to flow through Hormuz, trade flow normalization will take months, not weeks,” predicts Zhuwei Wang, director of research and analysis at S&P Global Energy.

The good news is that the repair process, for infrastructure and sentiment, can start today. It’s a recovery… if Washington and Tehran can keep it.


Fed Walks a Policy Tightrope as Iran Conflict Clouds the Outlook

The Federal Reserve is steering through one of the most challenging policy environments in years as the war with Iran destabilizes global energy markets and raises uncertainty about inflation and economic activity. The spike in geopolitical volatility leaves policymakers navigating an exceptionally narrow path: tightening too aggressively risks tipping the economy into recession, while easing too soon could reignite inflation. For the near term, the least worst option is to sit tight and leave rates unchanged until the incoming data start to make a strong case for changing the monetary policy bias.

The Cleveland Federal Reserve president, Beth Hammock, underscored this point in an interview with AP on Monday. Noting that keeping the Fed’s target rate steady for the near term “for quite some time” is her preference, “I can foresee scenarios where we would need to reduce rates … if the labor market deteriorates significantly,” she added. “Or I could see where we might need to raise rates if inflation stays persistently above our target.”

The Treasury market has recently recalibrated its outlook and is now firmly pricing in a higher probability of a rate hike in the near term after an extended run of dovish pricing. The policy-sensitive 2-year yield (3.84% as of Apr. 6) continues to trade above the median effective Fed funds rate (3.64%), marking a clear change in sentiment toward a hawkish bias for the first time since 2022.

The degree of future inflation risk remains debatable, as does the potential for a slowdown in economic growth. But the odds are widely perceived as higher for one or both sides of this coin.

“All roads now lead to higher prices and slower growth,” predicts IMF managing director Kristalina Georgieva. “We are in a world of elevated uncertainty,” she told Reuters yesterday, pointing to a variety of risk factors, including geopolitical tensions, technological advancements, climate shocks and demographic shifts. “All of this means that after we recover from this shock, we need to keep our eyes open for the next one.”

Current Fed policy is still modestly tight, based on a simple model using the unemployment rate and the year-over-year change in the headline Consumer Price Index. That gives the central bank space to take a wait-and-see approach and monitor incoming numbers.

Chicago Fed President Austan Goolsbee, however, suggests that a rate hike could be near. Asked to characterize the state of risk for the economic outlook using a four-color template, ranging from “the house is on fire” red to “everything is looking swell” green, he responded. “At least orange. Orange with ​a chance of meatballs; it hasn’t been great.”

The Treasury market is inclined to agree lately. But inflation and economic data arrive with a lag, and so the Fed will continue to wait to develop a clearer view of how the economy’s reacting to the war with Iran.

The challenge is not waiting too long, lest inflation and/or slower growth move too far ahead of policy, which would leave the Fed in the difficult position of trying to play catch-up. That was the case when the central bank was slow to raise rates when inflation spiked in 2021-2022, and so avoiding that mistake is very much a priority just a few years after that policy mistake.

At the same time, the risk of acting too early could make a bad situation worse, on either the inflation or growth fronts.

In the end, the Fed’s challenge is less about choosing the perfect policy setting and more about staying nimble in a world where the ground keeps shifting. The only certainty is that the next move—whenever it comes—will be made under conditions that are anything but certain.


Prolonged Stress Test Lurks for Global Markets as War Continues

Global markets are entering a sixth week of stress testing as the war with Iran continues with no immediate resolution in sight. The main risk factor remains the closure, or near‑closure, of the Strait of Hormuz, a strategic chokepoint through which roughly one‑fifth of global oil and liquefied natural gas flowed before the conflict began on Feb. 28.

Until energy exports through the Strait return to something approximating normal levels, a global shockwave will continue to reverberate across the world economy. The US is partly insulated because it is a net exporter of total petroleum, but oil is a globally priced commodity, so rising prices abroad still lift energy costs at home. Higher fuel prices will spill over into the broader economy, pushing up headline inflation and slowing growth to some degree. Uncertainty about the extent of these risks will keep markets on edge for the foreseeable future.

Investors have repriced assets accordingly since the war began, and this shift in risk appetite remains intact. With the exception of commodities, all major asset classes have declined in the regime shift triggered by the conflict with Iran.

Using a set of ETFs through Thursday’s close (Apr. 2), a broad commodities portfolio (GCC) is the lone upside outlier, rising 2.9% since the war began. At the opposite extreme, the biggest loser is global property stocks ex‑U.S. (VNQI), which have fallen nearly 12%.

In a sign of the times, the Global Market Index—a passive benchmark holding all major asset classes in market‑value weights except cash—has dropped 4.8% during the war. That’s a reminder that most globally diversified strategies have probably taken a hit during the war.

The crucial question for markets is when normal (or near‑normal) energy exports will resume. The odds of a quick resolution remain low, based on the latest news reports. Notably, President Trump on Sunday threatened to destroy Iran’s critical infrastructure unless it allows energy shipments to move through the Strait. Iran responded that new attacks on its civilian infrastructure would intensify Tehran’s strikes on energy facilities in the Gulf region.

As the war drags on, it is becoming clear that Iranian control over the Strait will not easily be dislodged without a deal with the government in Tehran. On that basis, a quick resolution may remain elusive.

Professor Robert Paper, a professor of political science at the University of Chicago who studies military strategy and international security, summarizes the challenge, warning that “The War Is Turning Iran Into a Major World Power.”

Modern economies do not simply require oil. They also require oil delivered on time, at scale and with predictable risk. When that reliability breaks down, insurance markets tighten, freight rates spike and governments begin to look at energy access as a complex strategic challenge rather than a simple market transaction.

The problem for the United States is one of asymmetry. Protecting each and every oil shipment that passes through the Strait of Hormuz against potential attacks — mines, drones, missile strikes — is a full-time operation. It requires continuous military presence. Iran needs only to hit an oil tanker once in a while to cast doubt on the reliability of the world’s oil shipments.

President Emmanuel Macron of France said as much on Thursday when he declared that it was “unrealistic” to open the Strait of Hormuz by force and that “this can only be done in concert with Iran.” He was all but admitting that the flow of oil cannot be guaranteed without Iran’s agreement.

Short of a complete regime change, Iran appears set to maintain significant influence over the flow of Middle East energy exports. Before Feb. 28, this risk factor was essentially off the radar for global markets. Now that it has become central to setting risk premiums and recalibrating risk appetite, markets are likely to remain volatile.

How long this transition lasts is anyone’s guess, but the aftershock of the war with Iran may last longer, and run deeper, than optimistic estimates suggest.

Is Recession Risk Rising? Monitor the outlook with a subscription to:
The US Business Cycle Risk Report

Book Bits: 04 April 2026

Recession: The Real Reasons Economies Shrink and What to Do About It
Tyler Goodspeed
Interview with author via CNBC
Q: You say recessions are unforecastable. What does that mean? There are a lot of people who try to predict them.
A: In a nutshell, it means recessions are about shocks, and they are shocks we can neither fully anticipate nor effectively hedge against. We have tools to predict recessions, like the yield curve. But when you actually test these tools on the historical record, there are a lot of false positives and false negatives. I’ll admit, I still look at the yield curve just to take a look. I’m not a believer in astrology, but I still take a peek at my horoscope now and then.

Investment Philosophies: Successful Strategies and the Investors Who Made Them Work (3rd Edition)
Aswath Damodaran
Summary via publisher (Wiley)
In the revised third edition of Investment Philosophies, Aswath Damodaran delivers a deep dive into a variety of investment philosophies, exploring the assumptions and beliefs that underlie each of them. You’ll explore the investment strategies that arise from each philosophy, as well as what you – as an investor – need to bring to the table to make the philosophy work in the real world. Rather than present one philosophy as the “one best” philosophy for all investors, the book presents a variety of choices, letting investors pick the one that best fits their personal beliefs about markets and personalities.

The Wage Standard: What’s Wrong in the Labor Market and How to Fix It
Arindrajit Dube
Excerpt via Big Think
What determines the extent of employers’ wage-setting power? It boils down to how easily — borrowing Beyoncé’s phrase — you can “release your job” when pay isn’t good enough. But how simple is it for someone to quit Walmart if they are dissatisfied with their wage?
To answer this question, my collaborators Suresh Naidu and Adam Reich and I surveyed about 10,000 Walmart workers in 2019 using a Facebook-based strategy, similar to the Shift Project. As we saw previously, Walmart, the nation’s largest private employer, has long been associated with low pay. In 2019, its voluntary company-wide minimum wage stood at $11 per hour, lagging behind competitors like Target and Costco. If paying jobs were truly easy to replace, one would expect Walmart jobs to be among the easier to quit and move on from, or market pressure would already have pushed Walmart wages to match those competitors.

Please note that the links to books above are affiliate links with Amazon.com and James Picerno (a.k.a. The Capital Spectator) earns money if you buy one of the titles listed. Also note that you will not pay extra for a book even though it generates revenue for The Capital Spectator. By purchasing books through this site, you provide support for The Capital Spectator’s free content. Thank you!

Total Return Forecasts: Major Asset Classes | 2 April 2026

The war with Iran started over a month ago, and could run for several more weeks, according to President Trump’s address to the nation last night. The short-term effects for markets have already been substantial, and more turbulence is potentially brewing for the near-term outlook. But even a month of war has yet to meaningfully change long-term expected returns for the major asset classes overall.

If financial markets continue to fall, at some point the decline will lift long-run performance expectations by more than a trivial degree. But in the context of our modeling for the long-term horizon (outlined below), last month’s slide in asset prices has been a marginal factor.

Today’s updated long‑term forecast for the Global Market Index (GMI) is relatively steady at a 7%-plus annualized total return. GMI’s projected long‑run outlook continues to run well substantially below its trailing ten‑year performance. It all adds up to a case for managing expectations down for performance relative to recent history – a shift that predates the war and, for now, doesn’t appear likely to change in the immediate future.

GMI is a market‑value‑weighted mix of the  major asset classes (excluding cash) via ETF proxies. The forecast is calculated as the average of three models (defined below). The current 7.2% annualized estimate for GMI is slightly below the previous estimate, and remains well below GMI’s trailing 9.0% annualized return for the past decade.

Roughly a third of GMI’s components are projected to generate weaker returns relative to their respective results over the past ten years (indicated by the red boxes in far-right column below). The same subpar performance applies to GMI, which is currently projected to earn a materially softer return compared with its realized performance for the trailing ten‑year window through March.


GMI represents a theoretical benchmark for the “optimal” portfolio that’s suited for the average investor with an infinite time horizon. Accordingly, GMI is useful as a starting point for customizing asset allocation and portfolio design to match a particular investor’s expectations, objectives, risk tolerance, etc. GMI’s history suggests that this passive benchmark’s performance will be competitive with most active asset-allocation strategies, especially after adjusting for risk, trading costs and taxes.

It’s likely that some, most or possibly all of the forecasts above will be wide of the mark in some degree. GMI’s projections, however, are expected to be somewhat more reliable vs. the estimates for its  components. Predictions for the specific markets (US stocks, commodities, etc.) are subject to greater variability compared with aggregating the forecasts into the GMI estimate, a process that may reduce some of the errors through time.

Another way to view the projections above is to use the estimates as a baseline for refining expectations. For instance, the point forecasts above can be adjusted with additional modeling that accounts for other factors and assumptions not used here. Customizing portfolios for a specfic investor, to reflect risk tolerance, time horizon, and so on, is also recommended.

For perspective on how GMI’s realized total return has evolved through time, consider the benchmark’s track record on a rolling 10-year annualized basis. The chart below compares GMI’s performance vs. ETFs tracking US stocks and US bonds through last month. GMI’s current return for the past ten years is a robust annualized 9.0%.

Here’s a brief summary of how the forecasts are generated and definitions of the other metrics in the table above:

BB: The Building Block model uses historical returns as a proxy for estimating the future. The sample period used starts in January 1998 (the earliest available date for all the asset classes listed above). The procedure is to calculate the risk premium for each asset class, compute the annualized return and then add an expected risk-free rate to generate a total return forecast. For the expected risk-free rate, we’re using the latest yield on the 10-year Treasury Inflation Protected Security (TIPS). This yield is considered a market estimate of a risk-free, real (inflation-adjusted) return for a “safe” asset — this “risk-free” rate is also used for all the models outlined below. Note that the BB model used here is (loosely) based on a methodology originally outlined by Ibbotson Associates (a division of Morningstar).

EQ: The Equilibrium model reverse engineers expected return by way of risk. Rather than trying to predict return directly, this model relies on the somewhat more reliable framework of using risk metrics to estimate future performance. The process is relatively robust in the sense that forecasting risk is slightly easier than projecting return. The three inputs:

* An estimate of the overall portfolio’s expected market price of risk, defined as the Sharpe ratio, which is the ratio of risk premia to volatility (standard deviation). Note: the “portfolio” here and throughout is defined as GMI

* The expected volatility (standard deviation) of each asset (GMI’s market components)

* The expected correlation for each asset relative to the portfolio (GMI)

This model for estimating equilibrium returns was initially outlined in a 1974 paper by Professor Bill Sharpe. For a summary, see Gary Brinson’s explanation in Chapter 3 of The Portable MBA in Investment. I also review the model in my book Dynamic Asset Allocation. Note that this methodology initially estimates a risk premium and then adds an expected risk-free rate to arrive at total return forecasts. The expected risk-free rate is outlined in BB above.

ADJ: This methodology is identical to the Equilibrium model (EQ) outlined above with one exception: the forecasts are adjusted based on short-term momentum and longer-term mean reversion factors. Momentum is defined as the current price relative to the trailing 12-month moving average. The mean reversion factor is estimated as the current price relative to the trailing 60-month (5-year) moving average. The equilibrium forecasts are adjusted based on current prices relative to the 12-month and 60-month moving averages. If current prices are above (below) the moving averages, the unadjusted risk premia estimates are decreased (increased). The formula for adjustment is simply taking the inverse of the average of the current price to the two moving averages. For example: if an asset class’s current price is 10% above its 12-month moving average and 20% over its 60-month moving average, the unadjusted forecast is reduced by 15% (the average of 10% and 20%). The logic here is that when prices are relatively high vs. recent history, the equilibrium forecasts are reduced. On the flip side, when prices are relatively low vs. recent history, the equilibrium forecasts are increased.

Avg: This column is a simple average of the three forecasts for each row (asset class)

10yr Ret: For perspective on actual returns, this column shows the trailing 10-year annualized total return for the asset classes through the current target month.

Spread: Average-model forecast less trailing 10-year return.

Learn To Use R For Portfolio Analysis
Quantitative Investment Portfolio Analytics In R:
An Introduction To R For Modeling Portfolio Risk and Return

By James Picerno

Major Asset Classes | March 2026 | Performance Review

Markets took a beating in March, thanks to the war with Iran. Commodities surged and cash edged higher, but the rest of the major asset classes fell, in some cases sharply, based on a set of proxy ETFs.

The only place to hide was in raw materials. The iShares S&P GSCI Commodity-Indexed Trust (GSG) soared more than 24% last month, and is now the top-performer over several trailing windows. To the extent that a given portfolio strategy is ahead of its rivals, there’s a decent chance that a relatively high weight in commodities and/or cash explain the alpha.

Red ink dominated the performance ledger otherwise in March. Global property shares ex-US (VNQI) were hit especially hard, tumbling more than 12% last month.

Despite the widespread selling, all the major asset classes are posting gains in year-over-year terms and for the trailing 3-year window. With reports emerging that the war could soon end, the optimists are arguing anew that March could soon be viewed as another painful but temporary diversion in an ongoing bull trend.

Repair and recovery, when it does begin, will certainly be welcome after last month’s carnage. The Global Market Index (GMI) in March posted its biggest monthly decline in 3-1/2 years. For perspective, keep in mind that the benchmark had been running hot for an extended period before the war, posting 11 straight months of gain, the longest stretch of wins in nine years. Something had to give, and in this case the war was the catalyst.

GMI is an unmanaged benchmark (maintained by CapitalSpectator.com) that holds all the major asset classes (except cash) in market-value weights via ETFs and represents a competitive benchmark for globally diversified, multi-asset-class portfolio strategies.


Bond Market Starting To Push Back On Powell’s Inflation View

Federal Reserve Chairman Jerome Powell may be downplaying inflation risks, but the bond market is signaling skepticism about how quickly price pressures will recede.

“Inflation expectations do appear to be well anchored beyond the short term, but nonetheless, it’s something we will eventually maybe face the question of what to do here,” Powell said on Monday at a talk at Harvard University. “We’re not really facing it yet, because we don’t know what the economic effects will be, but we’ll certainly be mindful of that broader context when we make that decision.”

The bond market is already mindful that the risk calculus has changed since the war started. The 2- and 10-year Treasury yields, for example, have shot up since the war started on Feb. 28. Although both rates are still trading at middling levels relative to their ranges in recent years, the rapid jump is hard to miss and is likely driven by concerns that inflation risk at the headline level is rising.

In line with the shifting sentiment, short-term inflation-indexed Treasuries (STIP) are the top performer this year for a set of bond-market ETFs through yesterday’s close (Mar. 30).

Headline inflation will almost certainly pulse higher in the near term in the wake of the sharp runup in energy prices, but some economists predict that the rise will be short-lived.

“Risks to inflation should rise initially but then fall if the shock is large enough, due to demand destruction,” economists at Bank of America Research estimated last week. “Negative wealth effects from a sustained equity selloff would exacerbate downside risks to labor and limit the upside to inflation.”

Rate hikes are still considered unlikely for the near-term outlook, but so are rate cuts, based on the implied probabilities via Fed funds futures.

The Treasury market’s implied inflation forecast via 5-year maturities has been breaking higher relative to the 10-year maturities. The implication: the market expects any increase in inflation pressure to be relatively short-lived. Note, too, that the Treasuries’ inflation outlook has yet to decisively break above recent peaks, which suggests that the crowd is not yet fully convinced that inflation is a threat that will outlast the war’s end.

Meanwhile, the longer the conflict lasts, the less patience the bond market will exhibit for tolerating the Fed’s preference to leave monetary policy as is. In that sense, President Trump has acquired a degree of power to effectively run Fed policy by determining when the war ends. Whether this influence will satisfy his preference for rate cuts, however, remains in doubt for the foreseeable future.  


US Q1 GDP May Improve As War Threatens the Outlook

US economic growth in the first quarter is still expected to rebound from the sluggish rise in Q4, but macro storm clouds are gathering for Q2 as the war in Iran continues.

The current nowcast for Q1 indicates an annualized 2.1% increase, based on the median estimate from a set of nowcasts compiled by The Capital Spectator. On that basis, growth will recover some of the lost momentum in Q4, when the economy expanded by a weak 0.7%.

Today’s Q1 estimate is down slightly from the previous update (Mar. 16). Further downgrades are possible, if not likely, between today and April 30, when the Bureau of Economic Analysis publishes its initial GDP estimate for Q1. Most of the economic data for the first three months of the year are expected to reflect pre-war activity. Although it’s unclear how the war has affected output in March, the fallout will probably be limited.

PMI survey data, however, suggest a non-trivial headwind in March. The US Composite PMI Output Index, a GDP proxy, fell to 51.4 this month, an 11-month low that reflects a weak growth bias. “The flash PMI survey data for March signal an unwelcome combination of slower growth and rising inflation following the outbreak of war in the Middle East,” says Chris Williamson, chief business economist at S&P Global Market Intelligence.

Joseph Brusuelas, chief economist at RSM, a consultancy, today writes: “Financial markets in the United States are pricing in a longer duration of the war in the Middle East. Our RSM US Financial Conditions Index, which has been decelerating since early February, has turned negative, implying a modest drag on growth.”

Deciding if a modest drag on growth deteriorates into something worse for Q2 will be determined by how the war evolves in the days and weeks ahead. Perhaps the only calculus that’s reliable at this point: the longer the conflict persists, the greater the economic damage.

The odds still suggest the US will avoid a recession starting at some point this year, according to Polymarket, a betting site. But this morning’s 37% chance of contraction by the end of 2026 has increased from 23% at the start of the war.

Some analysts say that markets are overreacting to the risks posed by the war. But with no sign of an end to the fighting on the immediate horizon, the potential threat to the global economy, with spillover effects for the US, will become harder to dismiss in the days ahead.

“Every recession since World War II, save the pandemic recession, has been preceded by a spike in oil prices,” Mark Zandi, chief economist at Moody’s Analytics, wrote last week. “Higher oil prices do not do the same economic damage as in years past, because the US produces as much as it consumes. But consumers still get hit hard and fast while producers invest and hire more only slowly, if at all, waiting to make sure the higher prices are here to stay.”

Is Recession Risk Rising? Monitor the outlook with a subscription to:
The US Business Cycle Risk Report

Book Bits: 28 March 2026

The Great Global Transformation: The United States, China, and the Remaking of the World Economic Order
Branko Milanovic
Review via Compact
According to Milanović, our decaying neoliberal order is so globalized and over-extended that it has coiled back in on itself, leaving us to commodify even our own leisure time by becoming increasingly incapable of enjoying it if it is not shared and displayed through social media… he sees little prospect of “re-embedding” market institutions in renewed social democracies and welfare states. While he sees neoliberal globalization coming to an end, he expects this process to crumble back into what he calls “national market liberalism”: neoliberal institutions confined to nations in which the balance between state and market remains tilted in favor of market elites.

The Quantamental Revolution: Factor Investing in the Age of Machine Learning
Milind Sharma
Summary via publisher (Wiley)
In The Quantamental Revolution: Factor Investing in the Age of Machine Learning, veteran quantitative investor and strategist, Milind Sharma, delivers a comprehensive discussion of factor investing, risk premia, smart betas, multi-factor models and the deployment of ML ensembles towards monetizing alpha in the hedge fund world. Sharma draws on 30 years of industry and academic experience to bring us up to date on the cutting edge of quantitative factor investing.

The Insatiable Machine: How Capitalism Conquered the World
Trevor Jackson
Review via The New York Times
In 2003, the literary theorist Fredric Jameson wrote that it was “easier to imagine the end of the world than to imagine the end of capitalism.” Trevor Jackson seems to agree, but only to a point. In “The Insatiable Machine: How Capitalism Conquered the World,” Jackson says that the prevailing economic system has already gone a long way toward destroying our “finite planet.” He argues that if we don’t find a way to change course, the end of the world won’t be something we have to imagine; it will actually arrive.

The Algorithm: The Hypergrowth Formula That Transformed Tesla, Lululemon, General Motors, and SpaceX
Jon McNeill
Review via ZD Net
The march to AI-driven technology development is hitting a wall — a wall of complexity. As AI increasingly becomes part of business, it is driving demand for well-designed infrastructure, resilient networks, and sophisticated software stacks that all demand human oversight and intervention.
That’s the word from Jon McNeill, CEO of DVx Ventures, former president of Tesla, and former chief operating officer of Lyft. McNeil is the author of a new book The Algorithm: The Hypergrowth Formula That Transformed Tesla, Lululemon, General Motors, and SpaceX. I recently had the opportunity to sit down with McNeill to discuss what IT professionals should consider and look for as they move into this new landscape.

Expectations Matter: The New Causal Macroeconomics of Surveys and Experiments
Olivier Coibion and Yuriy Gorodnichenko
Summary via publisher (Princeton U. Press)
How do expectations about the future influence economic behavior? For decades, economists have known that beliefs play a central role—from how much households spend, to how firms set prices, to how central banks design policy. But figuring out exactly how expectations affect decisions has been one of the field’s most persistent empirical challenges. In this book, Olivier Coibion and Yuriy Gorodnichenko present a fresh empirical approach: using randomized controlled trials (RCTs) to study the causal impact of expectations. Drawing on more than a decade of their research, they show how targeted information treatments can generate experimental variation in beliefs—making it possible to measure how those beliefs influence real-world decisions. Along the way, they reassess the limits of the traditional rational expectations framework and offer a richer, evidence-based picture of how people form and act on their views about the economy.

Please note that the links to books above are affiliate links with Amazon.com and James Picerno (a.k.a. The Capital Spectator) earns money if you buy one of the titles listed. Also note that you will not pay extra for a book even though it generates revenue for The Capital Spectator. By purchasing books through this site, you provide support for The Capital Spectator’s free content. Thank you!

Research Review | 27 March 2026 | Crash Risk

After the AI Crash: Bubble Burst or an Economy-Wide Crash?
Asad Ramzanali (Vanderbilt Policy Accelerator/Vanderbilt U.)
March 2026
Public concern about the level of AI investment is everywhere. While some compare today’s scenario to the dot-com bubble, the economy’s overreliance on AI investment, coupled with opaque financial engineering, means that a market correction could look more like the 2008 Great Recession, an economy-wide crash with systemic consequences. After such a crash, Congress will scramble to identify a reform agenda. In a rush, broader reforms that take time to formulate get shelved for quick action. It doesn’t have to be so. Instead of waiting for the crisis and hastily developing insufficient policies, lawmakers should prepare for this anticipated crisis now. Of course, a response depends on exactly how a crash comes to pass. But for meaningful reforms to have a chance, policymakers need to begin debating them. To that end, this paper describes how a crash might occur and outlines policies for Congress to consider in response.

Politics and Crash Risk
Kuntal Kumar Das and Mona Yaghoubi (U. of Canterbury)
March 2026
We examine whether firm-level political risk increases stock price crash risk and whether this effect varies systematically with firms’ political orientation. Using a large sample of U.S. publicly traded firms over an 18-year period, we find that political risk is a significant determinant of crash risk, but its effects are highly asymmetric. Firms led by Republican-leaning managers, firms adopting conservative financial policies, and firms operating in Republican-favored industries exhibit a markedly stronger sensitivity of crash risk to political risk than their Democratic-aligned counterparts. We further show that the impact of political risk is amplified when political signals are precise and informative and is concentrated among firms with low stock liquidity, consistent with information asymmetry and bad-news hoarding mechanisms. Together, our results link political polarization to financial instability and highlight the central role of ideology, information quality, and market microstructure in the transmission of political risk into extreme market outcomes.

Investor Sentiment and the Crash Risk of Anomalies
Timothy K. Chue and Katelyn Y. Hu (Hong Kong Polytechnic U.)
December 2025
We find that the return skewness of major stock market anomalies varies with investor sentiment. Following periods of low sentiment, these strategies exhibit significantly more negative skewness and greater crash risk, as evidenced by a more negative Conditional Value-at-Risk (CVaR). In contrast, these strategies display positive skewness following high investor sentiment. These findings contribute to the debate of whether it is risk or mispricing that explains anomaly returns. Our results suggest that left-tail risks cannot account for the higher returns earned by anomalies in high-sentiment states—taking tail risks into account in fact makes it more challenging to explain the state dependence of anomaly returns from a risk-based perspective. In contrast, our results are consistent with the mispricing perspective. If the extent of overpricing of the short side to an anomaly portfolio is indeed greater than the long side following high sentiment (as suggested by Stambaugh et al. 2012) and that crash risks are higher when investor sentiment and the degree of overpricing is high (as suggested by Baker and Wurgler 2006, 2007), the crash risk of the short side would also be greater than that of the long side—reducing the crash risks of the long-short portfolio during these times. Although diversification across anomalies enhances their Sharpe ratios, it fails to reduce their crash risks.

Speculative Growth and the AI “Bubble”
Ricardo J. Caballero (Massachusetts Institute of Technology)
December 2025
Are today’s high AI valuations a bubble? I argue the answer may be “both yes and no”-in a precise economic sense. Drawing on the speculative growth framework developed in Caballero et al. (2006), I claim that AI technology plausibly satisfies the conditions for multiple equilibria. The core mechanism in that framework is a funding feedback: as wealth accumulates, interest rates eventually fall, validating the high valuations that set the process in motion. AI technology reinforces this mechanism through a flat marginal product of capital region-arising from AI’s ability to substitute for labor across a broad range of tasks-which allows substantial capital accumulation without rapidly eroding returns. The concentration of AI gains among high-saving capital owners provides the funding feedback, while intermediate adjustment costs in building AI capacity allow asset prices to generate the capital gains that sustain an investment boom, while at the same time permit a rapid expansion in AI capital. When these conditions hold, the economy can sustain either a low-capital equilibrium with high interest rates, or a high-capital equilibrium with low interest rates, high market capitalization and, ultimately, high wages. Crucially, the transition to the highcapital equilibrium requires elevated valuations throughout: high asset prices finance the investment boom that ultimately validates the optimism. Yet this transition is fragile-a loss of confidence can trigger a self-fulfilling crash. The favorable outcome and high valuations are inseparable along the journey.

The disclosure dilemma: Industry distress and stock price crash risk
Chune Young Chung (Chung-Ang University), et al.
January 2026
This study examines how industry distress affects a firm’s stock price crash risk by altering managerial behavior. Drawing on the agency and disclosure theories, we hypothesize that managers in distressed industries may either hide or reveal bad news, thereby increasing or decreasing crash risk, respectively. Using industry short interest as an ex-ante measure of industry distress, we find that firms from more distressed industries are exposed to higher stock price crash risk in the future, especially when they demonstrate high information asymmetry. Our findings support the agency-motivated crash risk hypothesis that managers view negative industry shocks as threats and withhold negative information to obtain personal benefits.

Firm-Level Geopolitical Risk and Stock Price Crash Risk
Qingjie Du (University of Birmingham), et al.
January 2026
This paper constructs an innovative firm-level geopolitical risk exposure measure to explore the cross-firm heterogeneity. We find that higher firm-level geopolitical risk significantly increases future stock price crash risk. The effect of firm-level geopolitical risk on stock price crash risk is more pronounced for firms with greater product market competition, higher operational volatility, and higher financial constraints. But more experienced auditors help mitigate the detrimental impact. Our findings highlight the cross-firm heterogeneous exposure of geopolitical risk and show that high firm-level geopolitical risk affects corporate operation and incentivizes managerial information-hoarding, which ultimately increases the likelihood of stock price crashes.

Learn To Use R For Portfolio Analysis
Quantitative Investment Portfolio Analytics In R:
An Introduction To R For Modeling Portfolio Risk and Return

By James Picerno

Pages